
Figure 2.
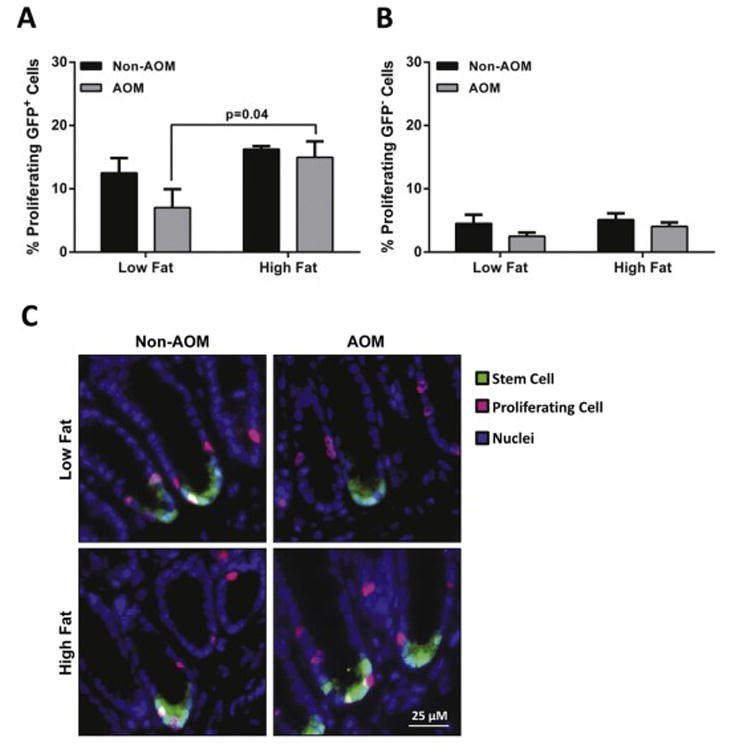
Proliferation of Lgr5-GFP+ and GFP negative cells from obese (HF) mice 12 h after AOM-injection. Colon samples were fixed in 4% PFA and paraffin embedded. Levels of cell proliferation were measured by the EdU Click-It assay. Data are expressed as percentage of EdU-labeled cells relative to the total number of (A) Lgr5-GFP+ stem cells and (B) non-GFP cells. (C) Representative micrographs for EdU—Alexa-647-stained (pink) proliferating cells, Lgr5-GFP+-Alexa-488-stained (green) stem cells and nuclei (blue). Data represent mean ± SEM (n=3-7 per group). Groups with a p-value <0.05 were considered statistically significant by Bonferroni’s multiple comparisons test following a two-way ANOVA.