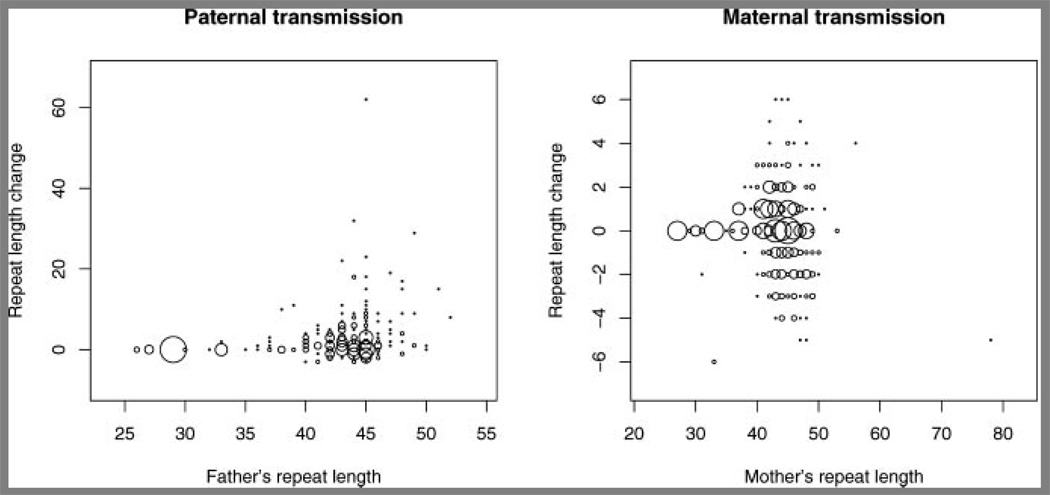
FIG. 2.
Plot of repeat length change on transmission versus the originating parental repeat length, for paternal and maternal transmissions of alleles with 27 or more CAG repeats. The radius of the circle is proportional to the number of transmissions observed at each point. The smallest circle represents one observation and the largest circle represents 15 observations. A total of 268 paternal transmissions and 379 maternal transmissions were traced. Note that the scales of the plots for paternal and maternal transmissions differ.

