
Figure 3.
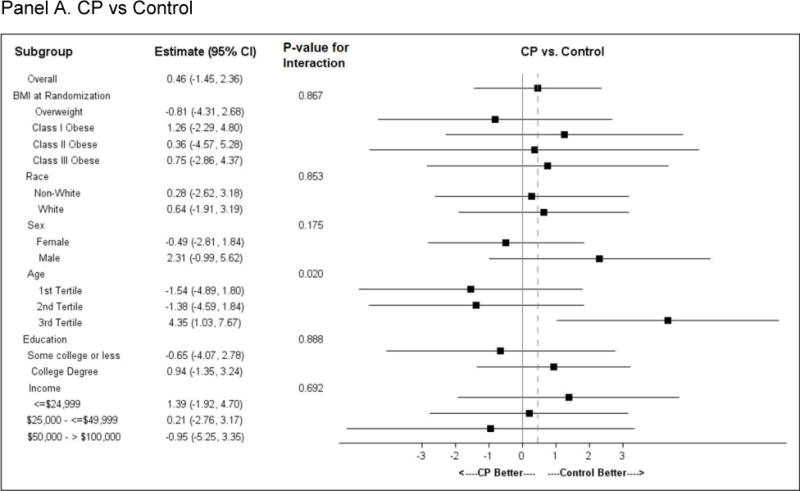
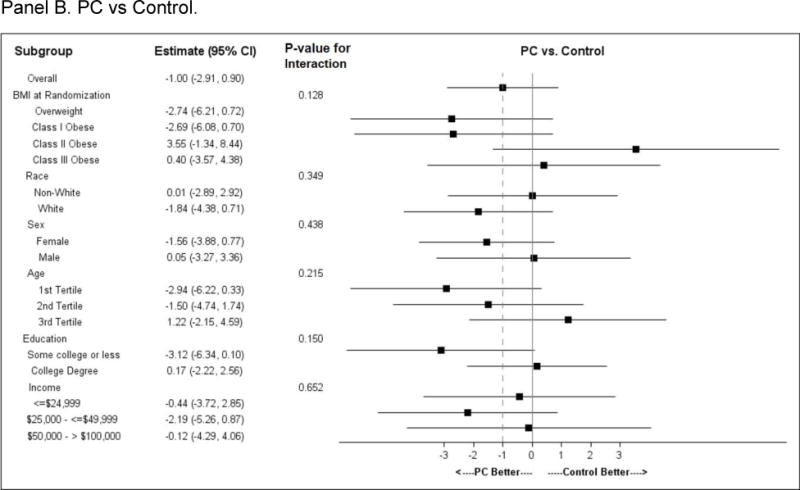
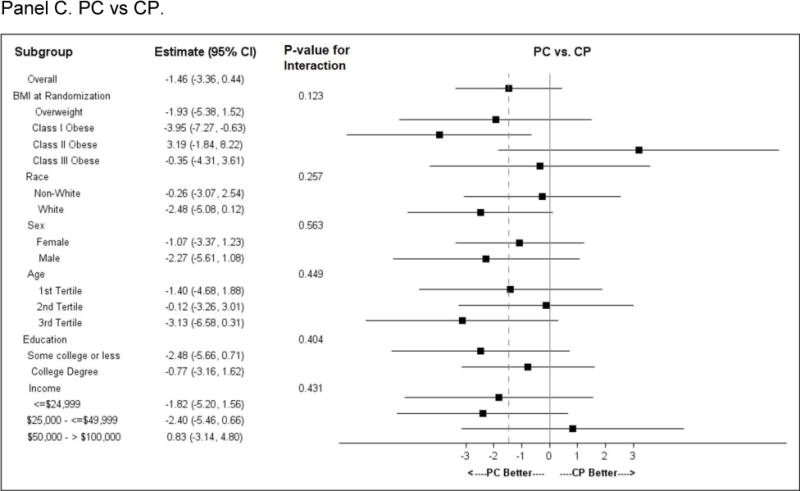
Subgroup analysis. Forest plots for pre-specified subgroups: age, sex, race; and post-hoc subgroup: BMI category, education category, and income category.
Panel A. CP vs Control; Panel B. PC vs Control; Panel C. CP vs PC
Official websites use .gov
A
.gov website belongs to an official
government organization in the United States.
Secure .gov websites use HTTPS
A lock (
) or https:// means you've safely
connected to the .gov website. Share sensitive
information only on official, secure websites.
Subgroup analysis. Forest plots for pre-specified subgroups: age, sex, race; and post-hoc subgroup: BMI category, education category, and income category.
Panel A. CP vs Control; Panel B. PC vs Control; Panel C. CP vs PC