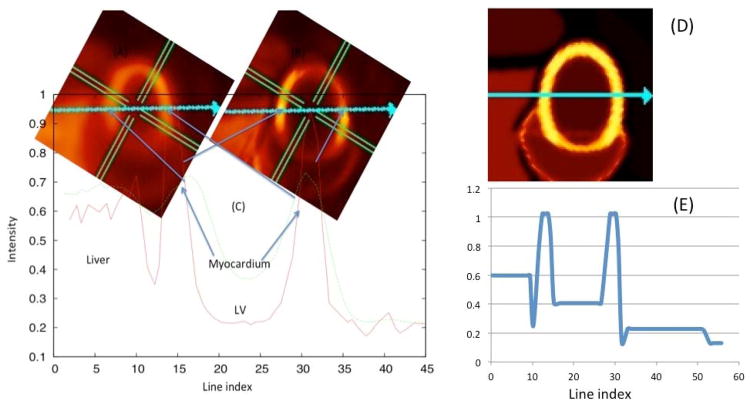
Fig. 13.
4D (spatiotemporal) reconstruction compared with 6D (temporal, cardiac, respiratory) reconstruction. The insets show the reconstructed images 4 min after tracer injection with the 4D reconstruction (A) and the 6D reconstruction (B) algorithm. (C) The line profile of myocardium intensity distribution along the line (shown by arrow) for 4D and 6D. (Right) The ground truth image (D) and corresponding line profile (E).

