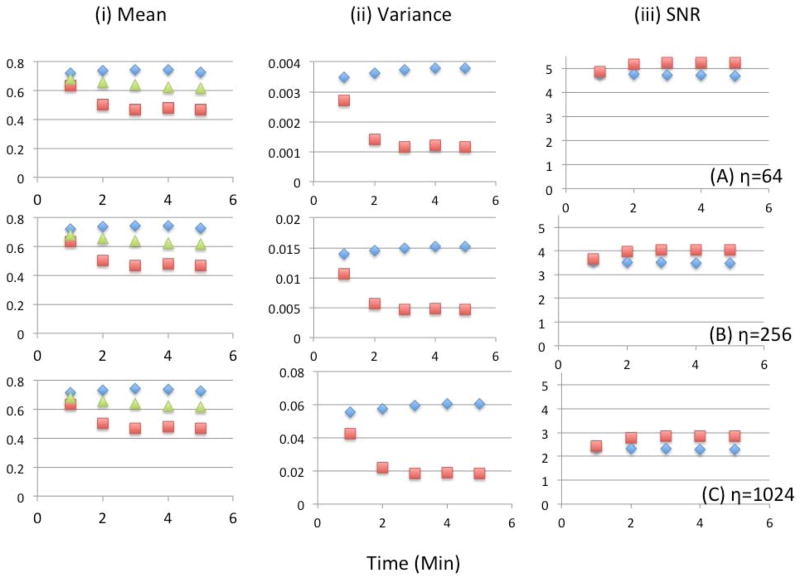
Fig. 16.
Statistical analysis for the 6D reconstruction (diamond, blue) compared with the conventional 4D reconstruction (square, red) as a function of time (minutes) after injection. Shown here are the (i) mean number of counts, (ii) variance, and (iii) SNR for 10 noise realizations for three different noise levels (A) η=64, (B) η=256 and (C) η=1024. The mean activity averaged over cardiac and respiratory gates of the ground truth (green triangle) is also shown.

