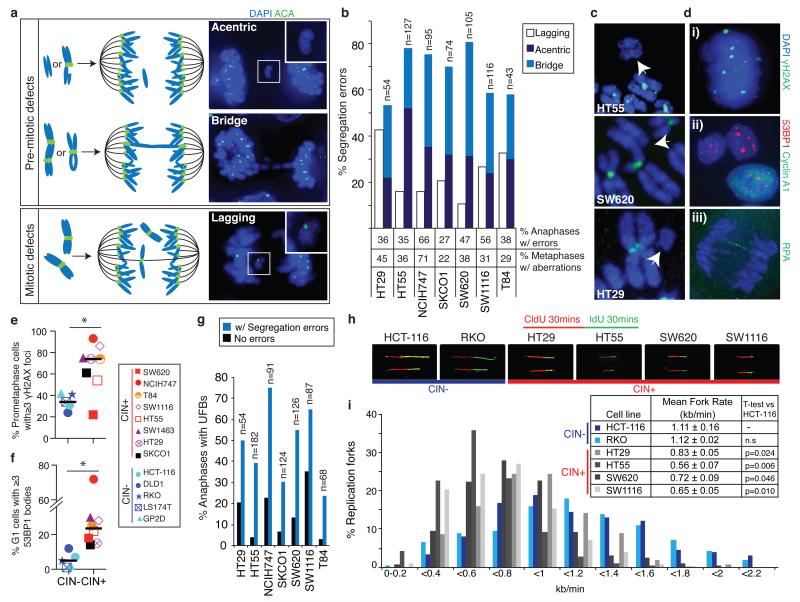
Figure 1. Replication stress generates chromosome segregation errors in CIN+ cells.
a) Schematic illustrating pre-mitotic and mitotic origins of chromosome segregation errors. Right panels: example images in SW1116 (CIN+) cells stained with DAPI and anti-centromere antibodies (ACA). b) % Segregation errors in CIN+ cell lines classified into lagging chromosomes, acentrics and anaphase bridges. Bridges extend fully between DNA masses; acentrics and lagging chromosomes were distinguished using ACA staining. Segregation errors not classifiable as bridges, lagging chromosomes or acentrics (<15%) are omitted for clarity. % Anaphases displaying segregation errors (n>100/cell line), and % metaphases displaying structural aberrations (n=38-84/cell line) shown below graph. c) Examples of structurally abnormal chromosomes identified on metaphase chromosome spreads, hybridised to an all-centromere probe (green) and stained with DAPI. d) Examples of replication stress-associated cellular phenotypes in NCIH747 (CIN+) cells stained with DAPI and antibodies as indicated; (i) γH2AX foci in prometaphase; (ii) 53BP1 bodies in G1 (cyclin A1-negative) cells; (iii) anaphase UFBs, detected with antibodies for the single-stranded DNA binding protein RPA27. e) % Prometaphase DNA damage in CIN+ versus CIN− cells (n>100 cells/cell line, *p=0.033). f) % G1 53BP1 bodies in CIN+ versus CIN− cells (n>250 cells/cell line, *p=0.028). g) % Anaphases with UFBs. h,i) 4 CIN+ and 2 CIN− cell lines were incubated sequentially with 5-chlorodeoxyuridine (CldU) and 5-iododeoxyuridine (IdU) for 30 minutes each. DNA fibre assays were performed and replication rates at individual replication forks were assessed. Representative fibres from each cell line are shown (h). i) Distribution of replication fork rates (CldU, n>300 forks in total/cell line from 3 experiments), with mean replication fork rates (CldU, n>60 forks/experiment, mean±s.e.m of 3 experiments) shown in the key (inset). Two-tailed t-test relative to HCT-116 cells.

