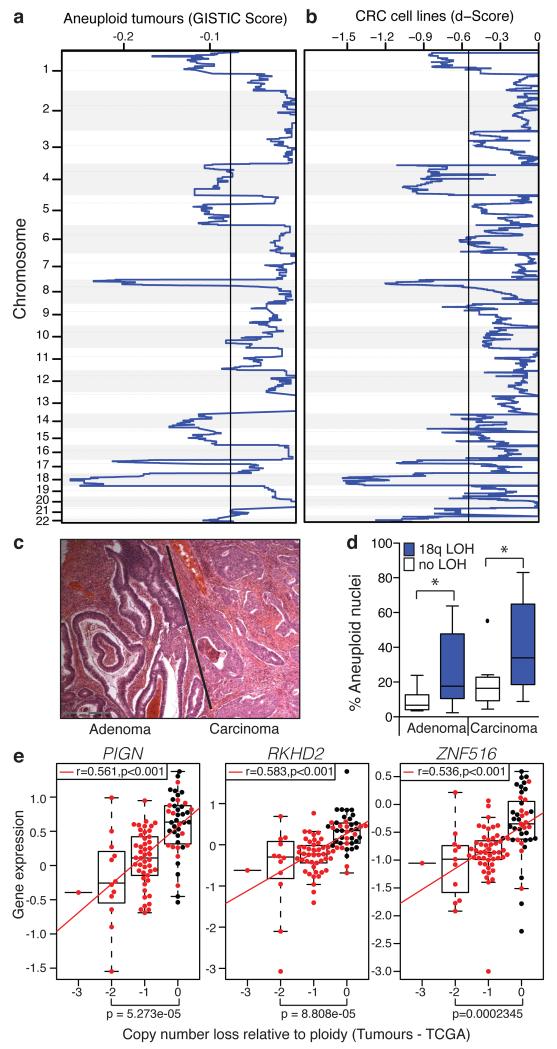
Figure 2. Somatic copy number loss of chromosome 18q in CIN+ CRC.
a) GISTIC analysis for somatic copy number loss in 26 aneuploid colorectal tumours. Q=0.25 determines significance (black line). b) Copy number losses in 20 CIN+ CRC cell lines. Significant regions were defined relative to 9 CIN− cell lines, (Q=0.25, black line). c) Haematoxylin and eosin-stained tumour specimen, showing adenoma with adjacent carcinoma. d) % Aneuploid nuclei, measured by DNA image cytometry, in paired adenomas and carcinomas (n=20) with/without 18q LOH (Tukey box plot with outliers displayed, two-tailed t-test, *p<0.05). e) Spearman’s rank correlation between mRNA expression and DNA copy number for PIGN, RKHD2 and ZNF516 in CIN− (n=28, black dots) versus CIN+ (n=74, red dots) tumours (TCGA). Tumours were defined as CIN+ based on a weighted genome integrity index >0.2 (see Methods). Statistic: Wilcoxon Mann-Whitney test.

