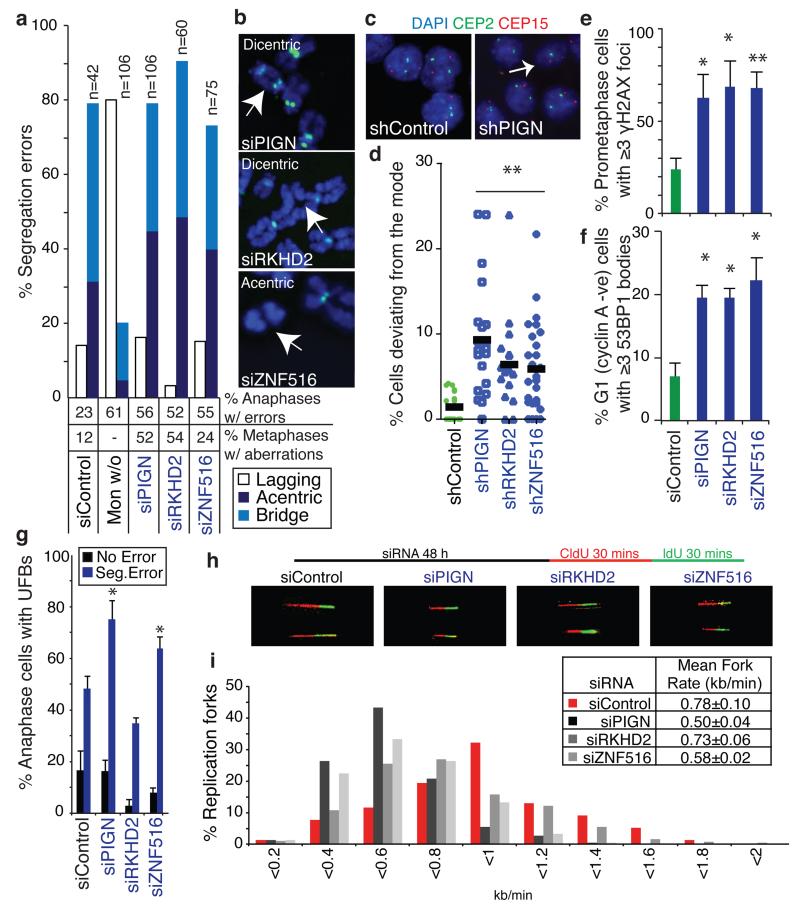
Figure 3. Candidate suppressors of replication stress and CIN encoded on chromosome 18q.
a,b) CIN-suppressor genes were silenced in HCT-116 (CIN−) cells for 48 h. a) % Segregation errors accounted for by lagging chromosomes, acentrics and anaphase bridges. Other segregation errors (<15%) are omitted for clarity. For comparison, segregation errors arising via improper chromosome attachments were induced by monastrol treatment (100 μM, 1 h, 75 min release). % Anaphases displaying segregation errors and % metaphases displaying ≥1 structurally abnormal chromosome (n>100) shown below graph. b) Examples of structurally abnormal chromosomes as indicated. c,d) Cell lines stably expressing shRNAs as indicated were seeded at low density on glass slides to allow colony formation. Slides were fixed and hybridised to DNA probes for centromeres 2 and 15. c) Example images of control and shPIGN cells. d) % Deviation from the modal centromere copy number per colony (mean of two probes (CEP2 and CEP15)). Lines are median values, statistic: Dunn’s Multiple Comparison test, p<0.01. e-g) HCT-116 cells were scored for replication stress-associated phenotypes following siRNA-mediated CIN− suppressor gene silencing: e) % Prometaphases exhibiting ≥3 γH2AX foci (mean±s.e.m, 3 experiments, n>100/experiment); f) % G1 cells with ≥3 53BP1 bodies (mean±s.e.m, 3 experiments, n>150/experiment); g) % Anaphases with UFBs (mean±s.e.m, 3 experiments, n=100/experiment). Statistical tests for e-g) were two-tailed t-tests, *p<0.05, **p<0.01. h,i) DNA fibre assays were performed following siRNA transfection as indicated. Representative fibre images for siRNA transfections as indicated as shown (h). i) Distribution of replication fork rates (n>200 forks in total per siRNA transfection from 2 experiments) with mean fork rates (n>70 forks/experiment, mean±s.d of 2 experiments) shown in the key (inset).

