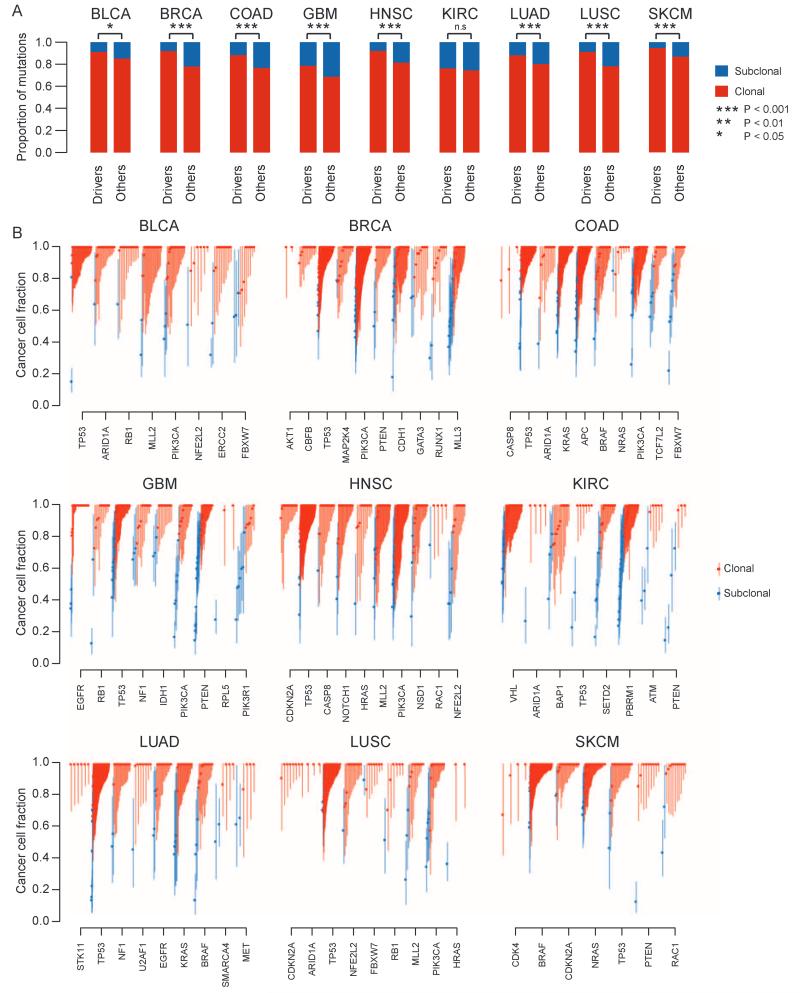
Fig. 2.
Clonal and subclonal mutations in nine cancer types. (A) The proportion of aggregated driver mutations versus other mutations that are clonal/subclonal is indicated for each cancer type. Red represents clonal mutations, and blue represents subclonal mutations. Notably, there is a higher proportion of clonal driver mutations compared to other clonal mutations. Significance from Fisher’s exact test is indicated. Exact P values are as follows: BLCA, P= 0.0292; BRCA, P= 8.19× 10⁻²¹; COAD, P= 1.45× 10⁻⁹; GBM, P= 0.000791; HNSC, P= 2.58× 10⁻⁸; KIRC, P= 0.619; LUAD, P= 0.00311; LUSC, P= 1.89× 10⁻⁵; SKCM, P= 2.71 × 10⁻⁵. (B) The cancer cell fraction of mutations in driver genes within each cancer type is depicted. Each symbol represents a somatic mutation in an individual tumor. On the basis of the probability distributions of the cancer cell fraction, mutations were determined to be either clonal (red circles, upper bound of confidence interval ≥1) or subclonal (blue circles, upper band of confidence interval <1). Error bars represent the 95% confidence interval.

