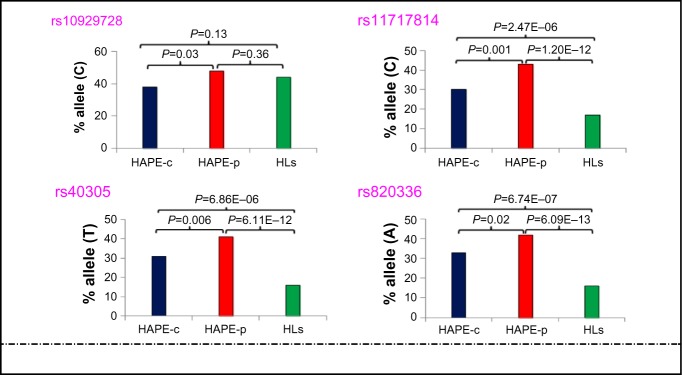
Figure 2.
Allelic distribution of the four significant SNPs in the three study groups.
Notes: Y-axis represents the percentage of minor allele and X-axis represents the three study groups. SPSS Version 16 and SNPStats softwares were used to calculate the P-values.
Abbreviations: HAPE, high altitude pulmonary edema; HAPE-c, HAPE controls; HAPE-p, HAPE patients; HLs, highlanders; SNPs, single-nucleotide polymorphisms.

