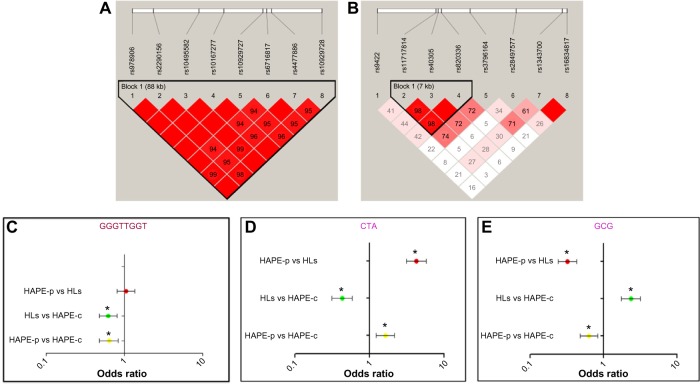
Figure 3.
Linkage disequilibrium (LD) and forest plots of ROCK2 and MYLK.
Notes: (A) 88 kb ROCK2 block and (B) 7 kb MYLK block. SNPs were arranged according to the chromosome position. Gabriel et al’s39 confidence interval algorithm was chosen to build the blocks. The values in the boxes represent the D′ values. Standard (D′/LOD) color scheme was kept for the LD plot. (C) ROCK2-protective haplotype GGGTTGGT. (D) MYLK-risk haplotype CTA and (E) MYLK-protective haplotype GCG. The order of alleles in the forest plots is as follows: for ROCK2, rs978906, rs2290156, rs10495582, rs10167277, rs10929727, rs6716817, rs4477886, and rs10929728, and for MYLK, rs11717814, rs40305, and rs820336. *P<0.05.
Abbreviations: HAPE, high altitude pulmonary edema; HAPE-c, HAPE controls; HAPE-p, HAPE patients; HLs, highlanders; LOD, logarithm of the odds; SNPs, single-nucleotide polymorphisms.

