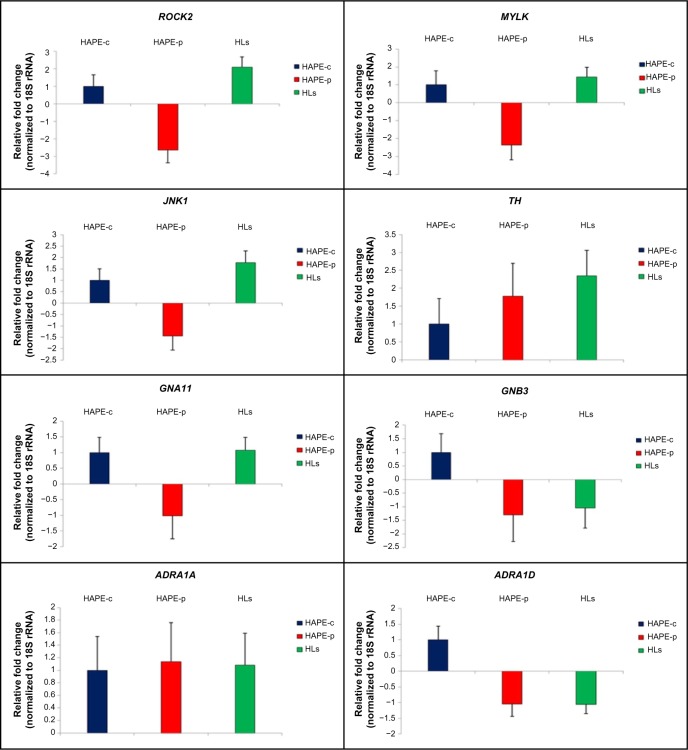
Figure 6.
Quantitative real-time PCR.
Notes: Histogram shows the relative fold change. Error bars show the standard deviation of deltaCt values obtained per group. ROCK2 expression, error values: HAPE-c =0.67, HAPE-p =0.73, and HLs =0.58. MYLK expression, error values: HAPE-c =0.79, HAPE-p =0.83, and HLs =0.54. JNK1 expression, error values: HAPE-c =0.50, HAPE-p =0.63, and HLs =0.51. TH expression, error values: HAPE-c =0.71, HAPE-p =0.92, and HLs =0.71. GNA11 expression, error values: HAPE-c =0.49, HAPE-p =0.74, and HLs =0.41. GNB3 expression, error values: HAPE-c =0.68, HAPE-p =0.98, and HLs =0.74. ADRA1A expression, error values: HAPE-c =0.54, HAPE-p =0.62, and HLs =0.51. ADRA1D expression, error values: HAPE-c =0.44, HAPE-p =0.40, and HLs =0.30.
Abbreviations: HAPE, high altitude pulmonary edema; HAPE-c, HAPE controls; HAPE-p, HAPE patients; HLs, highlanders; PCR, polymerase chain reaction.

