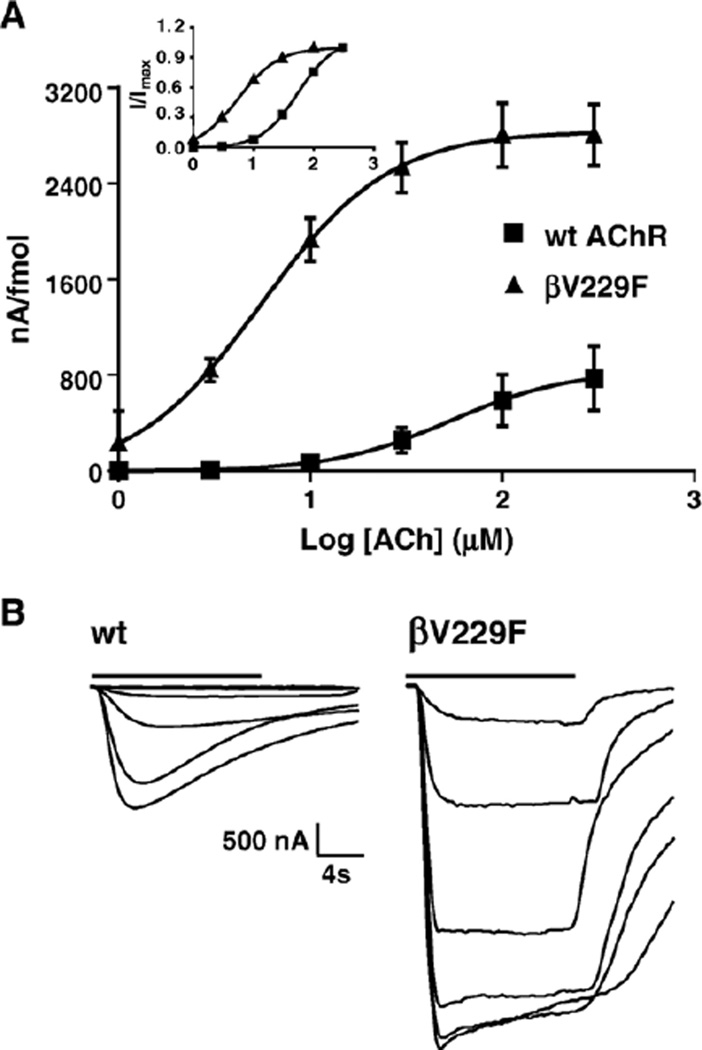
Fig. 3.
Functional consequences of wild-type and βV229F AChR expressed in Xenopus oocytes. (A) Dose–response curves from muscle wild-type and βV229F voltage-clamped oocytes. Peak for individual oocytes was obtained from ACh-induced current at 1, 3, 10, 30, 100 and 300 µM ACh. The values at each concentration were averaged, and dose–response curves were reconstructed and normalized to nA per fmol. Inset represents dose–response curves for each of the AChRs tested normalized to maximal response. (B) Representative inward current traces showing normalized ACh-induced current from wild-type and the βV229F mutation. Bars on top of the macroscopic currents traces represent ACh application. The estimated parameters of the fitted curves are summarized in Table 3.

