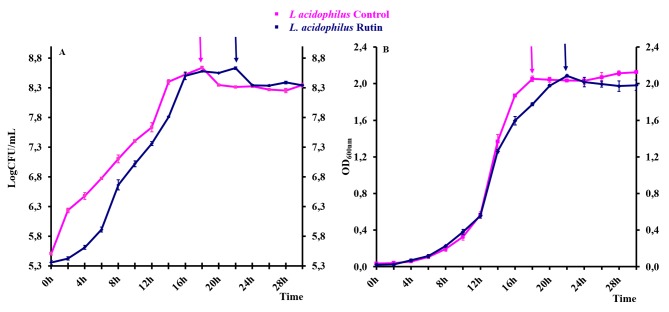
Fig 1. Growth curves of L. acidophilus in control conditions and in the presence of rutin.
(A) Growth curves of L. acidophilus obtained by plate counting. (B) Growth curves of L. acidophilus obtained measuring the optical density at 600 nm. Arrows indicate the times of bacterial cell collection for the further proteomic analyses. Values are the means of four independent experiments.

