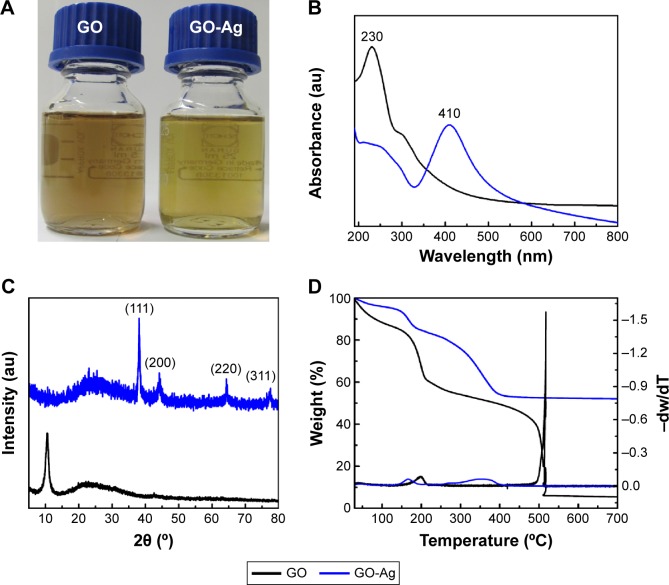
Figure 1.
Photographs of the GO and GO-Ag dispersions (50 µg mL−1) (A). UV-vis absorption spectra of GO and GO-Ag dispersions (B). XRD patterns of GO and GO-Ag nanocomposite (C). Thermogravimetric curves of GO and GO-Ag (D).
Abbreviations: GO, graphene oxide; GO-Ag, graphene oxide-silver nanocomposite; XRD, X-ray diffraction; UV-vis, ultraviolet-visible.

