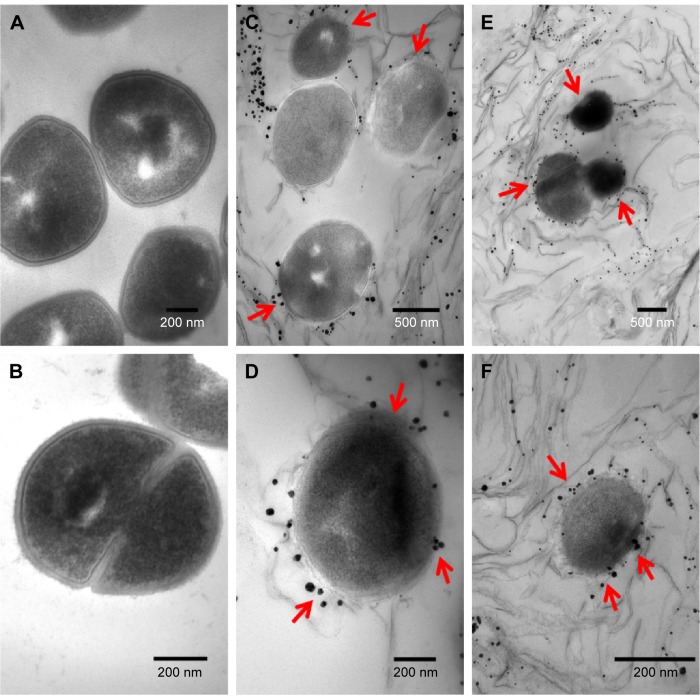
Figure 6.
TEM images of MRSA cells not exposed to GO-Ag nanocomposite (A, B); and MRSA cells treated with 15 µg·mL−1 GO-Ag for 2 h (C–F). The cell membranes were severely damaged after exposure to GO-Ag. Visible damage on the cell surface is indicated by red arrows (C–F).
Abbreviations: MRSA, methicillin-resistant Staphylococcus aureus; TEM, transmission electron microscopy; GO-Ag, graphene oxide-silver nanocomposite; h, hours.

