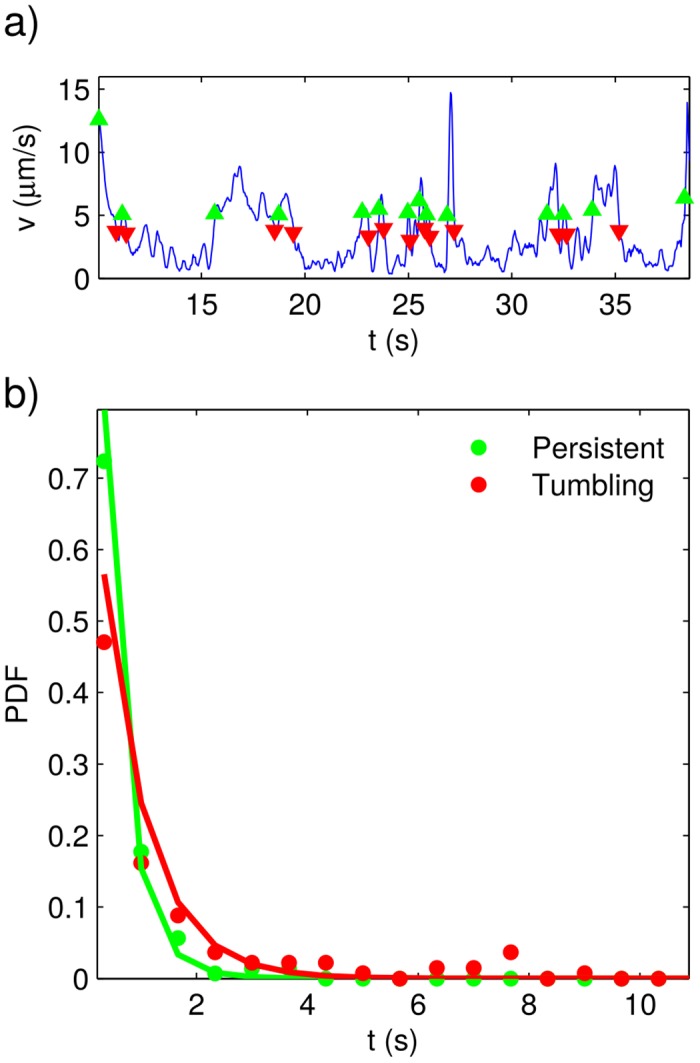
Fig 5. Persistent-motion and tumbling times for the genetically-modified strain.

a) Plot of instantaneous speed vs. time for a typical trajectory. The times at which persistent-motion and tumbling segments begin are respectively indicated with green and red triangles. b) Experimentally determined (dots) and best-fitting distributions (solid lines) for the persistent-motion and tumbling residence times.
