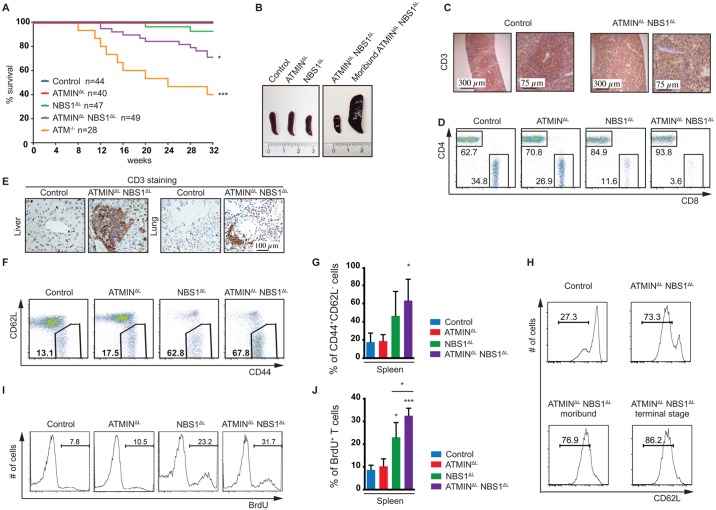
Fig 2. Loss of ATMIN in combination with NBS1, in T cells, leads to increased mortality due to T cell activation.
(A) Kaplan-Meier survival curve of control, ATMINΔL, NBS1ΔL, ATMINΔLNBS1ΔL and ATM-/- mice. Survival was monitored for 32 weeks. (B) Representative images of spleens of control, ATMINΔL, NBS1ΔL and ATMINΔLNBS1ΔL mice as well as a moribund ATMINΔLNBS1ΔL mouse. (C) Histological analysis of the spleen of a control and a moribund ATMINΔLNBS1ΔL mouse stained for T cells using an anti-CD3 antibody. (D) Representative flow cytometry data of CD4 and CD8 T cells (gated on the TCRβ+ population) in the spleen of control, ATMINΔL, NBS1ΔL and ATMINΔLNBS1ΔL mice. (E) Histological analysis by using an anti-CD3 antibody to visualize T cells in the liver and lung of control and ATMINΔLNBS1ΔL mice. (F) Representative flow cytometry data of activated CD62LlowCD44+ T cells (gated on the TCRβ+ population) in the spleen of control, ATMINΔL, NBS1ΔL and ATMINΔLNBS1ΔL mice. (G) Quantification of F. N = 3–4 mice per genotype. (H) Flow cytometry data showing the percentage of antigen-experienced CD62LlowCD4+ T cells (gated on the TCRβ+ population) in the spleen of control and ATMINΔLNBS1ΔL mice as well as moribund ATMINΔLNBS1ΔL mice. (I) Representative flow cytometry data of proliferating (BrdU+) T cells (gated on the TCRβ+ population) in the spleen of mice indicated in F, measured by in vivo BrdU incorporation over a period of 4 days. (J) Quantification of I. N = 3–4 mice per genotype. Error bars represent SEM (*P<0.05, ***P<0.001).

