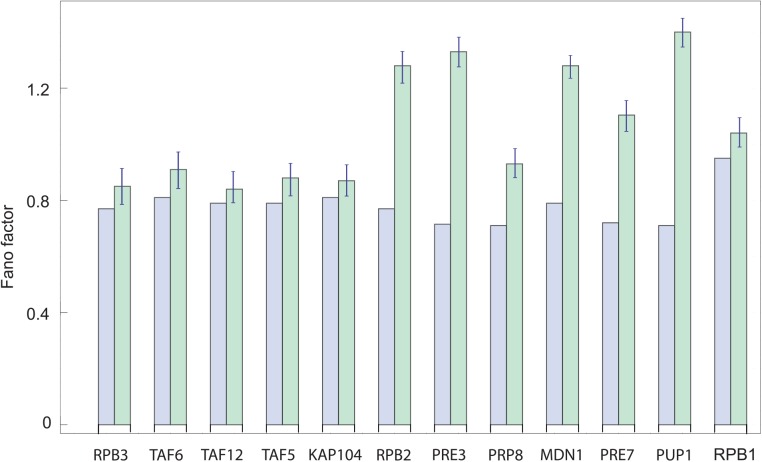
Fig 4. Comparison of predicted and measured Fano factors for cytoplasmic mRNA distributions.
Fano factors for the cytoplasmic mRNA distributions, as predicted by the one-step (RPB1), two-step (KAP104, TAF5, TAF6, TAF12, RPB2, RPB3, MDN1) and three-step (PUP1, PRE3, PRE7, PRP8) mechanisms of initiation, are shown as blue bars. These are compared with the measured cytoplasmic mRNA distributions, shown in green bars, as reported in ref [25]. In cases when the measured distributions have higher Fano factors than predicted, this is indicative of significant sources of noise downstream to transcription initiation and elongation that affect the cell-to-cell variability of cytoplasmic mRNA.

