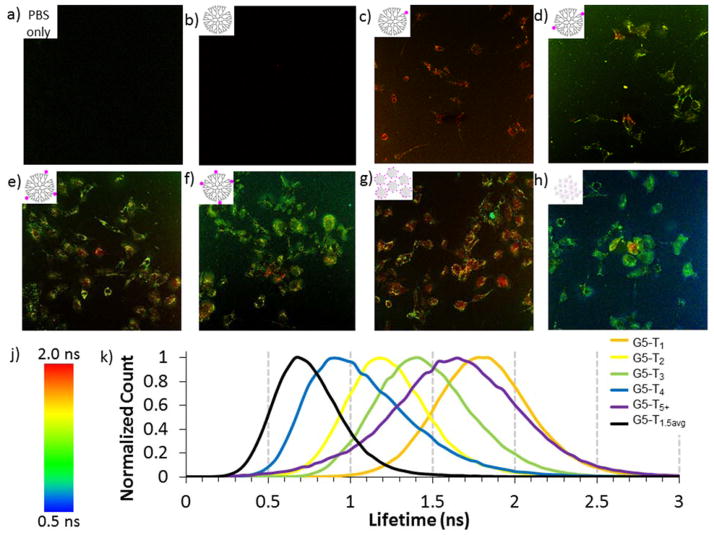
Figure 5.
FLIM images of HEK293A cells incubated for three hours with a) PBS only b) G5-NH2 c) G5-NH2-TAMRA1 d) G5-NH2-TAMRA2 e) G5-NH2-TAMRA3 f) G5-NH2-TAMRA4 g) G5-NH2-TAMRA5+ h) G5-NH2-TAMRA1.5avg. j) Color code for FLIM images. k) Histograms of fluorescence lifetimes for FLIM images. Images were obtained with a 40x oil immersion objective. The same set of image locations is presented in Figure 4 using confocal fluorescence microscopy.

