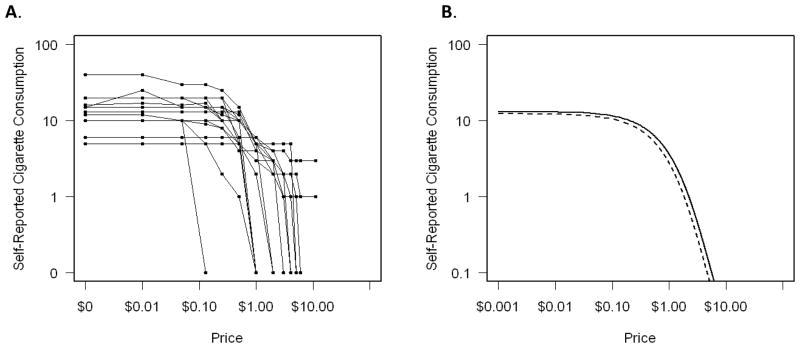
Figure 2.
Cigarette demand using a cigarette purchase task in smokers from the Enhanced Quit &Win study. Panel A depicts the observed demand curves of 20 randomly selected subjects from the study. Panel B depicts the fitted demand curves for females (solid line) and males (dashed line) separately based on the left-censored mixed effects model with gender interactions. The x-axis is price in dollars and the y-axis is self-reported consumption in cigarettes. Log-log coordinates are used.

