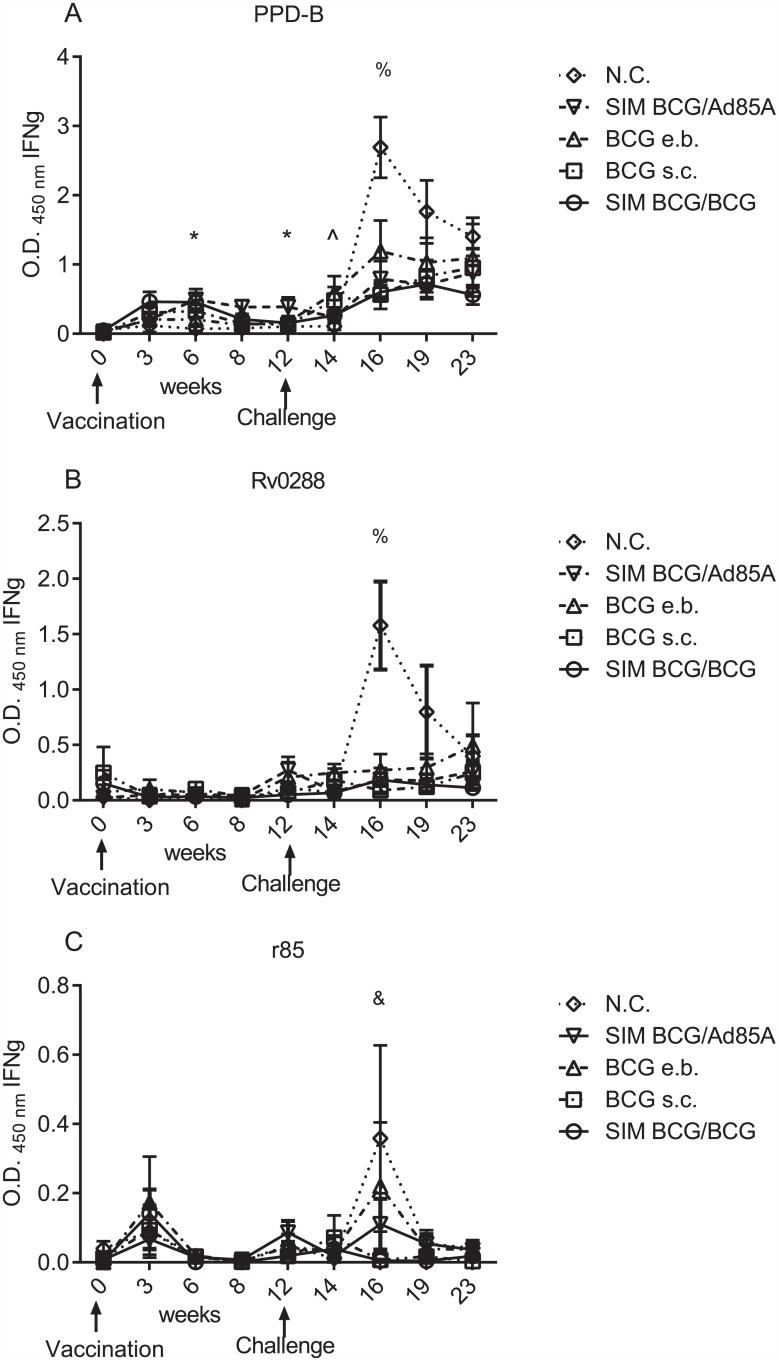
Fig 1. Different vaccination regimes induced different responses to mycobacterial antigens.
Determination of the secretion of IFNγ by whole blood cells, measured by ELISA, from animals vaccinated with BCG at week 0 and challenged with M. bovis at week 12; vaccination and challenge are indicated by arrows on the x axis. Group average of antigen-specific whole blood IFNγ secretion, expressed as OD 450nm, was corrected for background and evaluated at the weeks indicated on the x axis. Animal groups are indicated naïve controls (N.C.) (open rhomboid); SIM BCG/Ad85A (inverted open triangle); BCG e.b. (open triangle); BCG s.c. (open square); SIM BCG/BCG (open circle). Error bars represent the standard error of the mean (SEM). Data were analysed using a using a Kruskal-Wallis test with Dunn’s multiple column post-test comparison. Statistical significance is indicated as follows: * difference between BCG/Ad85A and N.C.; ^ indicates differences between BCG e.b. and N.C.; % indicates differences between BCG s.c. and N.C.; & indicates differences between BCG/BCG and N.C. One symbol indicates ρ<0.05.

