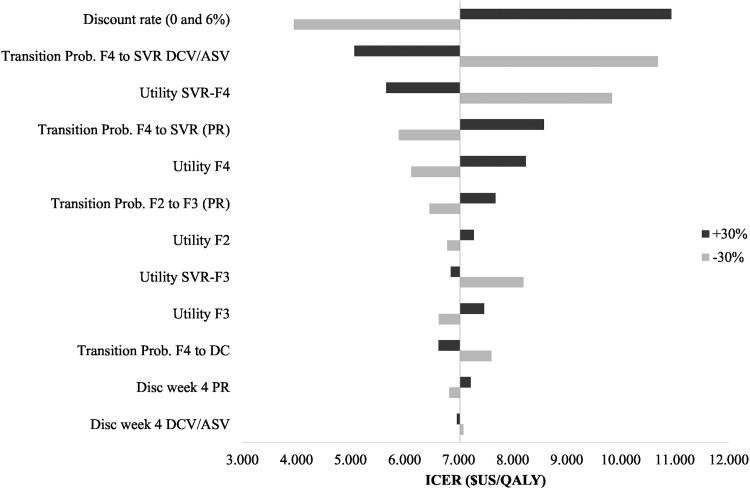
Fig 2. Deterministic sensitivity analysis tornado graph: Tornado graph showing the variation of the ICER when parameters are varied independently.
The parameters with highest impact on the ICER are shown on the graph: transition probability from F4 to SVR when the treatment is DCV/ASV and PR, transition probability from F2-F3, transition probability from f4 to DC, QALY of the SVR-F4 and SVR-F3 states, QALY of the F2, F3 and F4 state, treatment discontinuation at week 4 for PR and DCV/ASV.

