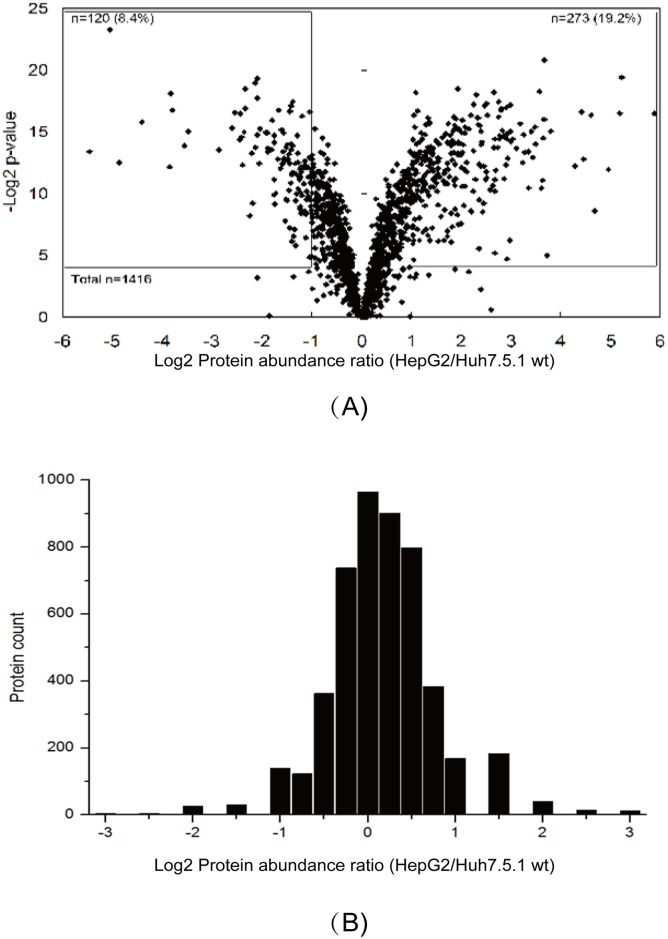
Fig 2. Quantitative analysis of proteins abundance changes detected using the label-free and iTRAQ approaches.
(A) The volcano plot shows t-test p-values plotted against log2 values of protein fold changes. Data points in the lower center area of the plot have a log2 value close to 0 and a p value approaching 1 and indicate no significant change, whereas points in the upper left and upper right quadrants indicate significant negative and positive changes in protein abundance, respectively. (B) The iTRAQ ratio was transformed by log2 analysis. The proteins with abundance ratio within the range from -1 to +1 indicate no significant changes, and values larger than +1 or lower than -1 indicate significant positive and negative changes in protein abundance, respectively.

