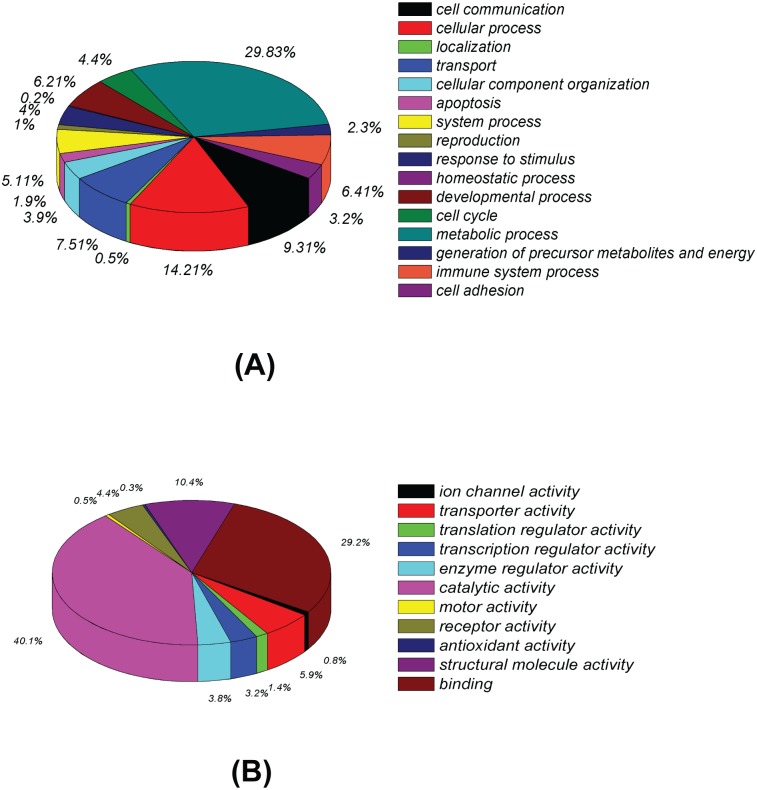
Fig 3. Classification of differentially expressed proteins based on GO annotation.
(A) Categorization based upon biological process analysis of total differential protein expression. (B) Categorization based upon molecular function analysis of total differential protein expression. The distribution frequencies in regard to the specified categories within the given charts are indicated in % of the total number of protein entries.

