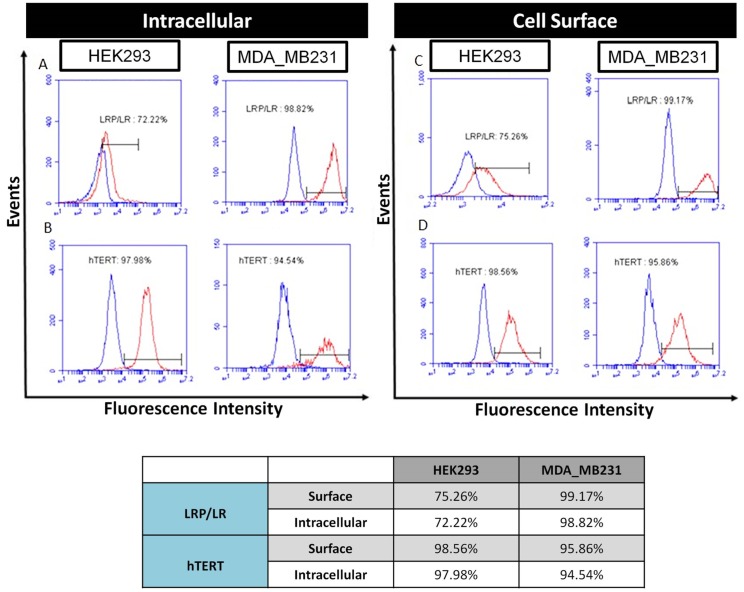
Fig 1. Flow cytometric detection of intracellular and cell surface levels of LRP/LR and hTERT on HEK293 and MDA_MB231 cells.
A) Intracellular levels of LRP/LR in permeabilised HEK293 and MDA_MB231 cells were determined primarily by incubating the cells with IgG1-iS18 followed by incubation with anti-human-FITC coupled secondary antibodies (Sigma-Aldrich). B) Intracellular levels of hTERT in permeabilised HEK293 and MDA_MB231 cells were determined primarily by incubating the cells with anti-Telomerase reverse transcriptase antibody followed by incubation with goat anti-mouse IgG-APC coupled secondary antibodies (Sigma-Aldrich). C) Cell surface levels of LRP/LR in non-permeabilised HEK293 and MDA_MB231 cells were determined primarily by incubating the cells with IgG1-iS18 followed by incubation with anti-human-FITC coupled secondary antibodies (Sigma-Aldrich). D) Cell surface levels of hTERT in non-permeabilised HEK293 and MDA_MB231 cells were determined primarily by incubating the cells with anti-telomerase reverse transcriptase antibody followed by incubation with Goat anti-mouse IgG-APC coupled secondary antibodies (Sigma-Aldrich). The blue curve represents the no primary antibody control (to account for non-specificity of the secondary antibodies), whilst the red curve represents cells that were treated with both primary and secondary antibodies. The percentage represents the proportion of cells within the population which expressed LRP/LR and hTERT intracellularly and on the cell surface. This was calculated using a linked marker from the point of intersection between the curves to the end of the red curve.

