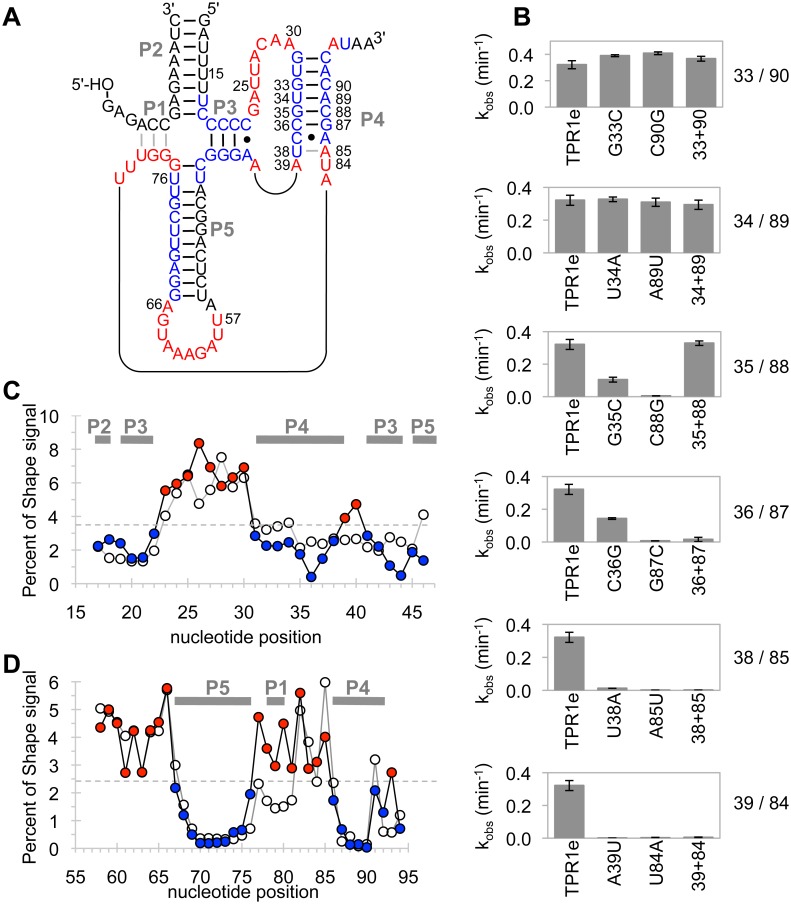
Fig 3. Experiments testing the formation of duplex P4.
(A) Proposed secondary structure for ribozyme TPR1e showing proposed paired regions labeled P1-P5. All duplexes with exception of P4 were identified previously [16]. Nucleotides found accessible by Shape probing are colored in red, while protected nucleotides are shown in blue. C-A pairs are shown with a dot. The numbering scheme corresponds to the cis-acting ribozyme (Fig 1). Note that the duplexes P1 and P2 are formed in trans because the experiments were performed using the trans reaction. Base pairs for duplex P1 are shown in grey because for TPR1e, nucleotides 78–80 appeared accessible by Shape probing. (B) Apparent triphosphorylation rates of the mutated ribozymes in the base covariation experiment of twelve bases in the proposed P4 duplex. The six column graphs are in the same order as the proposed based pairs in P4 of Fig 3A. Each graph shows the triphosphorylation rate of TPR1e on the left, the two single mutants in the middle, and the double mutant on the right. Error bars are standard deviations of triplicate experiments. (C) Shape probing experiments for nucleotides 17 to 46 of the ribozymes TPR1 (empty circles) and TPR1e (colored circles). The normalized Shape signal is shown as a function of nucleotide position. A threshold value (grey, dashed line) is used to distinguish between low Shape reactivity (blue) and high Shape reactivity (red). The colors match the color-coding in Fig 3A. The position of duplexes P1-P5 in TPR1e is indicated by thick, solid, grey, horizontal lines. (D) As in (C) but for nucleotides 57 to 94 in the ribozymes.

