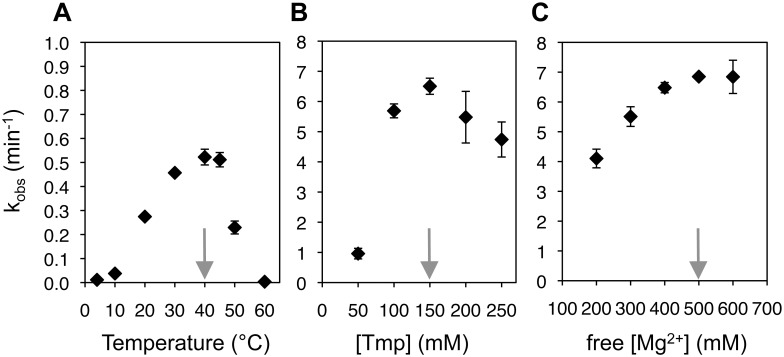
Fig 4. Determination of optimal TPR1e triphosphorylation conditions.
(A) Observed triphosphorylation rate as function of the temperature, at 50 mM Tmp, 100 mM MgCl2, and 50 mM Tris/HCl pH 8.3 (B) Influence of the trimetaphosphate concentration on the observed reaction kinetics at 40°C, and with an excess of 400 mM MgCl2 over Tmp. (C) Influence of the free Mg2+ concentration on the triphosphorylation rate at 40°C and 150 mM Tmp. The free Mg2+ concentration is the total Mg2+ concentration minus the concentration of Tmp because each Tmp appears to be coordinated by one Mg2+ at these concentrations and pH 8.3 [16]. The grey arrows indicate the optimum condition for each series of experiments. Note that the scale in (A) is different from the scale in (B) and (C). Error bars are standard deviations of triplicate experiments.

