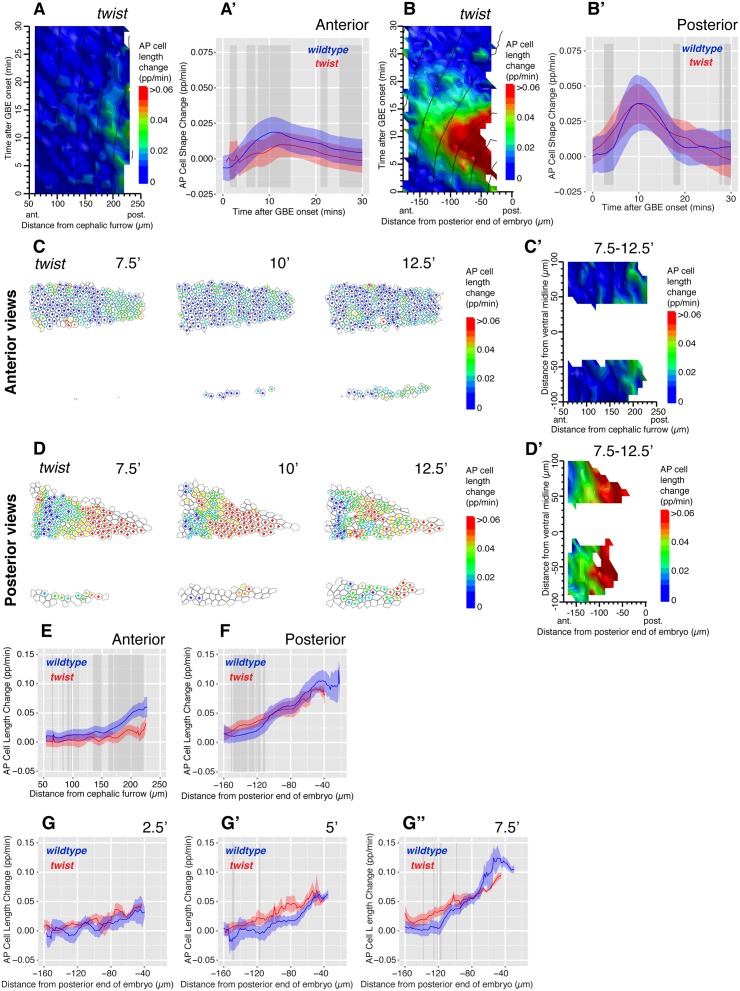
Fig 3. The AP cell elongation gradient is present in twi mutant embryos.
(A) Spatiotemporal map summarizing AP cell length change contributing to GBE, over the first 30 mins of GBE (y-axis), and as a function of cell position in the AP axis (x-axis), for twi mutants in anterior views (average for five embryos). (A’) Graph comparing AP cell length change as a function of time for the first 30 min of GBE, in wild-type (blue) and twi mutants (red) for anterior views (average for five embryos each). In these graphs and thereafter, the ribbon’s width indicates the standard error, and the grey-shaded boxes show where a difference is statistically significant (p < 0.05, see Materials and Methods). (B, B’) Equivalent plots as A, A’ for posterior views. (C, D) AP cell length change shown for each analyzed cell, for timepoints 7.5, 10, and 12.5 min after GBE onset in twi mutant embryos, for movie frames of an anterior (C, twiLB012) and a posterior view (D, twiCL140411). The color of the dot at the center of each cell corresponds to the scale bar shown. (C’, D’) Spatial maps summarizing AP cell length change over the 7.5–12.5 mins time interval, as a function of the position of cells in the AP (x-axis) and DV (y-axis) embryonic axes, for anterior and posterior views in twi mutants (average of five and three embryos per view, respectively). (E, F) Graphs comparing AP cell length change over the 7.5–12.5 min time interval, as a function of cell position in the AP axis, for wild-type (blue) and twi mutant (red) embryos, for anterior and posterior views. (G–G”) Graphs summarizing AP length change (y-axis), at 2.5, 5, and 7.5 min after the onset of GBE, as a function of cell position in the AP axis (x-axis) for wild-type (blue) and twi mutant (red) embryos, for posterior views (average for four and three embryos per genotype, respectively). Data associated with this figure can be found in S3 Data.

