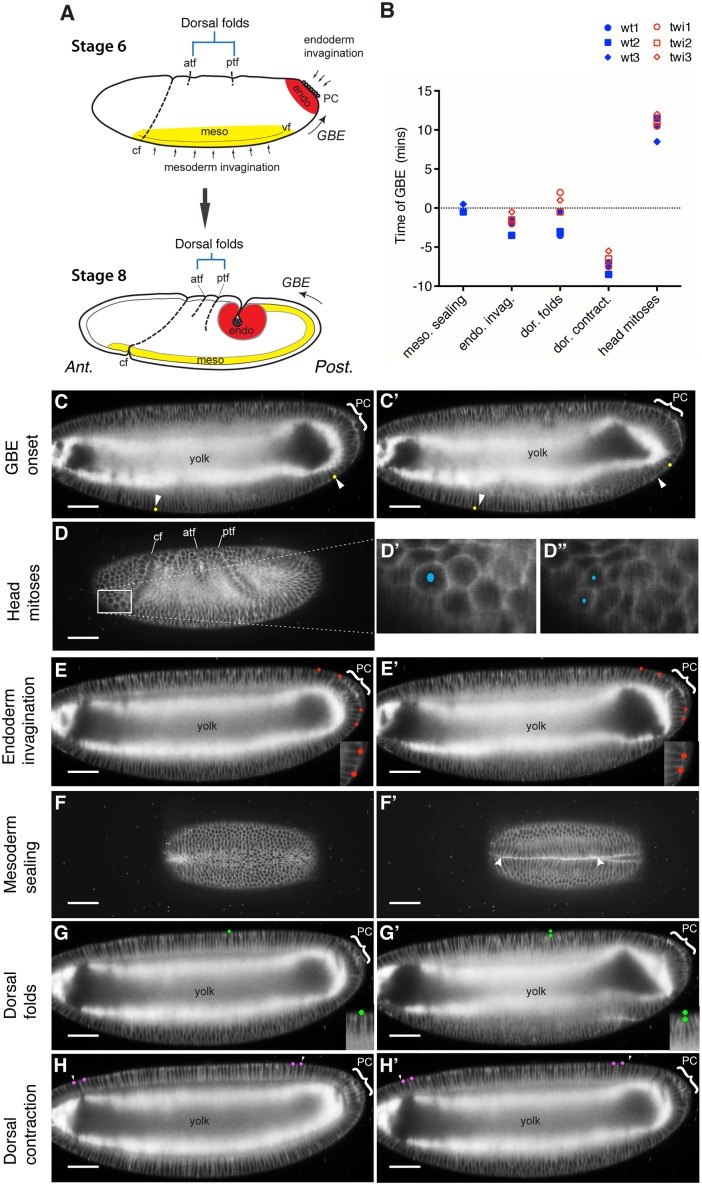
Fig 4. Temporal relationships between morphogenetic movements during Drosophila gastrulation.
(A) Diagram showing the sites of the different morphogenetic movements on lateral views of stage six and eight embryos (see also Fig 1A and 1A’). The invaginating mesoderm and endoderm layers are shown in yellow and red, respectively. At stage six, these layers are in the process of invagination from the surface to the interior of the embryo, and by stage eight, both of these layers are fully internalized. PC, pole cells; CF, cephalic furrow; ATF, anterior transverse furrow; PTF, posterior transverse furrow; GBE, germband extension. (B) Graph summarizing the temporal mapping of the head mitoses and four morphogenetic events relative to the onset of GBE, for three wild-type and three twi mutant movies. (C–H’) All views are taken from a wild-type embryo labeled with the whole-membrane markers resille-GFP and spider-GFP and imaged by light sheet microscopy (SPIM). For each morphogenetic movement, two movie frames are shown, before and after the temporally mapped event. The position of the pole cells (PC) at the posterior of the embryos are indicated by a bracket. All embryos shown are at either late stage five or early stage six, except the embryo in D, which is at stage eight. At these early stages, embryonic cells are arranged in a single columnar layer surrounding a large yolk cytoplasm, visible as a bright signal in lateral views. (C, C’) Lateral views showing the mapping of individual cells (yellow dots) 1 min before (C) and 1.5 min after (C’) the onset of GBE. The arrowheads indicate the position of the cells before the start of GBE. (D–D”) Lateral views with a box highlighting the mitotic domain 2 in the head [40], with close-up in (D’) showing a cell about to divide and (D”) the two resulting daughter cells 3.5 min later. (E, E’) Lateral views showing the mapping of cells (red dots) 2 min before (E) and 2 min after (E’) the onset of apical constriction in the endoderm primordium. The close-ups show that the cells between the pair of red dots constricted their apices, causing the dots to move closer together. (F, F’) Ventral view showing the ventral furrow 2.5 min before (F) and 1.5 min after (F’) mesoderm sealing. (G, G’) Lateral view showing the mapping of the apical surface of a cell in comparison to its original position (green dots) on the dorsal surface 2.5 min before (G) and 4 min after (G’) the initiation of the posterior transverse fold (one of the two dorsal folds). The close-up shows the basalwards displacement of the apical surface. (H, H’) Lateral view showing the movement of individual cells (magenta dots) 1 min before (H) and 3 min after (H’) dorsal contraction. The arrowheads show the cells’ positions before contraction. Data associated with this figure can be found in S4 Data.

