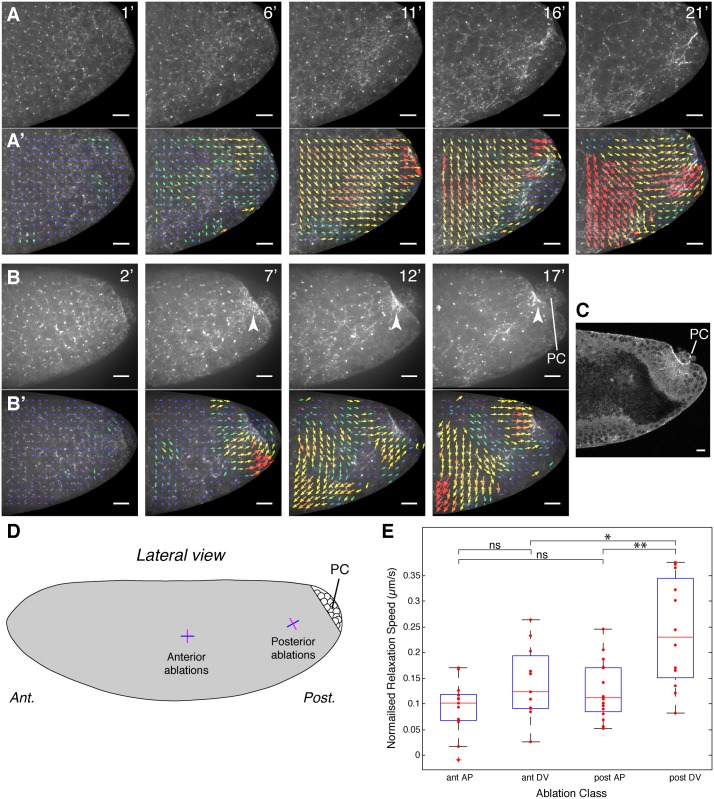
Fig 6. Apical constriction of the posterior endoderm primordium generates a tensile stress in acellular embryos.
(A, B) Examples of movies of the posterior lateral surface of acellular embryos, with the actomyosin cytoskeleton labelled with sqh-GFP (see also S8 Movie, from which example A is taken). The Myosin II signal forms a disorganized meshwork at the apical surface of the embryo, which concentrates in the region close to the PC (see arrows in B). Occasionally, the meshwork becomes more cable-like, orienting towards the presumptive posterior endoderm (identified by the position of the PC). (A’, B’) Particle Imaging Velocimetry (PIV) tracking of the Myosin II signal reveals flows towards the presumptive posterior endoderm. Note that the ventralward flows also seen here move towards the ventral presumptive mesoderm (see S8 Movie). Arrows represent the displacement from the previous timepoint, scaled by a factor of four. Magnitude is shown using a heat scale, with fastest flows in red. Times shown are from the start of the movies. Scale bars are 20 microns. (C) Cross section of the posterior of an acellular embryo stained for Myosin II (see S6 Fig), showing the concentration of Myosin II where the apical surface has contracted and the beginning of an invagination. PC are indicated. (D) Schematics showing the position of the laser cuts performed on the lateral surface of the presumptive germband in acellular embryos (approximately to scale). The cuts are along a line 20 microns long, positioned either at the anterior (ant.) or at the posterior (post.) of the embryo, either orthogonal to the posterior flows (magenta, called DV thereafter for simplicity) or parallel to them (blue, called AP thereafter). (E) Dot plot with box plot overlaid showing the normalized relaxation velocities (corrected for displacement) for each category of cuts (n = 13 for ant. AP; n = 11, ant. DV; n = 16, post. AP; n = 12, post. DV). A two sample t test was used for the statistics (comparison ant. AP and ant. DV, ns: p = 0.070; comparison ant. AP and post. AP, ns: p = 0.1225; *: p = 0.0173; **: p = 0.0011). For the box plots, the central red line is the median, the edges of the box are the 25th and 75th percentile, the whiskers extend to the most extreme points not considered outliers, and outliers are plotted individually (Data points considered outliers are those more than 2.7 standard deviations from the mean). Data associated with this Figure can be found in S6 Data.

