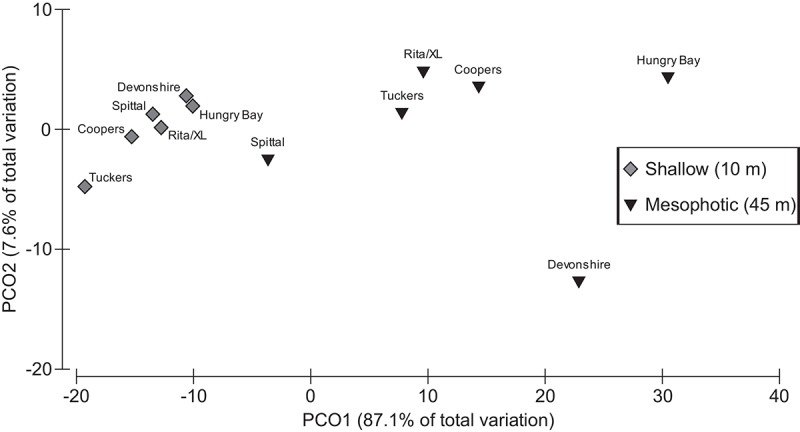
Fig 6. PCO of Population Structure by Site.

Principal coordinates analysis (PCO) of M. cavernosa size-frequency distributions for each survey location (Rita/XL, Coopers, Tuckers, Spittal, Devonshire, Hungry Bay) at 10m and 45m depths. PCO1 and PCO2 axes together capture 94.7% of the total variation in size-frequency distribution.
