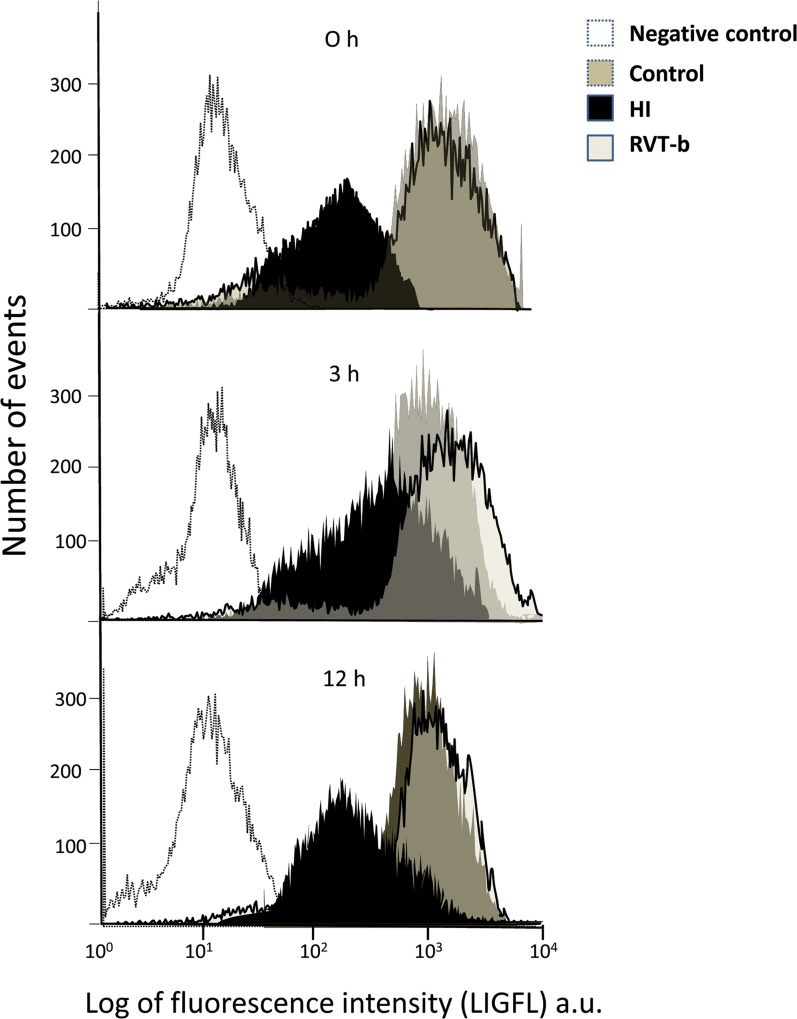
Fig 9. Representative fluorograms obtained after flow cytometry analysis showing mitochondrial transmembrane potential measured as Rh 123 fluorescence at different points of time after hypoxia-ischemia (0 h, 3 h and 12 h) in control, HI and animals pretreated with resveratrol.
The x-axis represents the number of events and the y-axis represents the values of fluorescence intensity in logarithm values. The negative control consisted of unstained samples from each animal to remove the autofluorescence.

