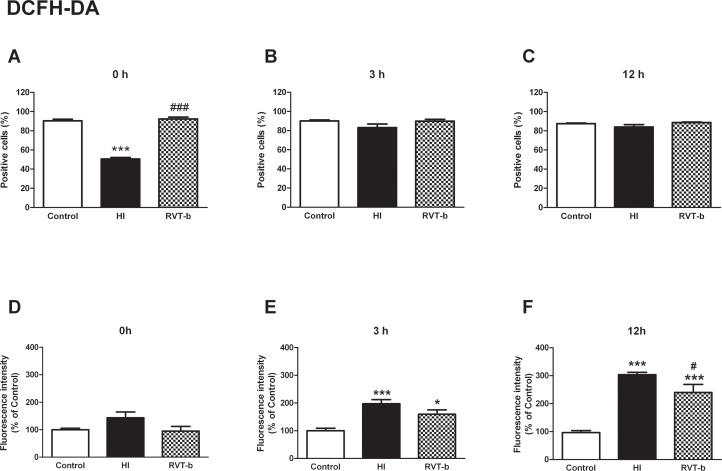
Fig 10. Effect of brain hypoxia-ischemia on the production of reactive oxygen species in suspension of acutely isolated cells, measured using DCFH-DA.
Percentage of DCFH-DA positive cells at different time points after hypoxia-ischemia: (A) 0 h, (B) 3 h and (C) 12 h. Relative fluorescence intensity of cells with in vivo marker DCFH-DA at different time points after hypoxia-ischemia; (D) 0 h, (E) 3 h and (F) 12 h, in control (n≥5), HI (n≥5) and animals pretreated with resveratrol (n≥5) groups. Asterisks denote the significance levels when compared to the control group (*** P<0.0001 * P<0.05). The hash symbols denote the significance levels when compared to the hypoxia-ischemia group (### P<0.0001 or # P<0.05).

