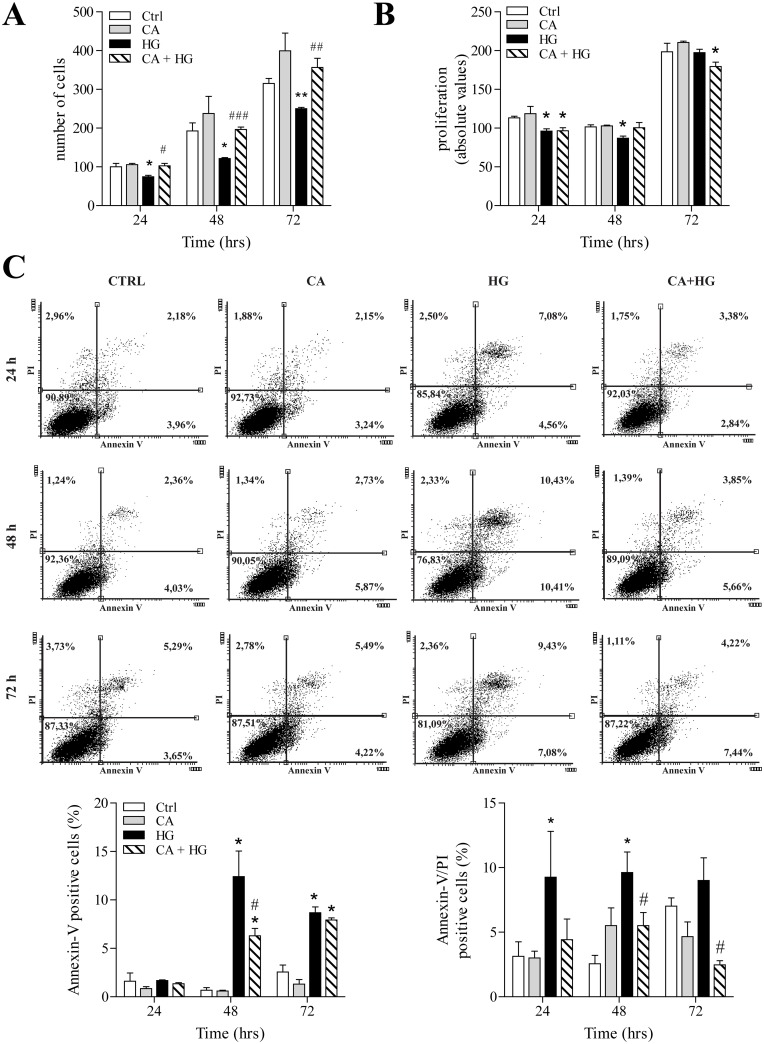
Fig 4. Effect of CA on cell proliferation and apoptosis.
Cells were treated for 24, 48 and 72 hours as indicated in the figures. Panels show: A) cell count expressed as number of cells per well; B) Proliferation analysis by BrdU incorporation; C) Representative dot plots of cell distribution after double labeling with Annexin-V and PI. Data are expressed as percentage of induction of early (Annexin V positive cells) and late stages of apoptosis (Annexin-V/PI double positive cells). *p<0.05 HG vs control; **p<0.001 vs control; # p<0.05 CA+HG vs HG. ## p< 0.001 and ### p< 0.0001 CA+HG vs HG. Values are the mean ± SEM from at least 3 independent experiments.

