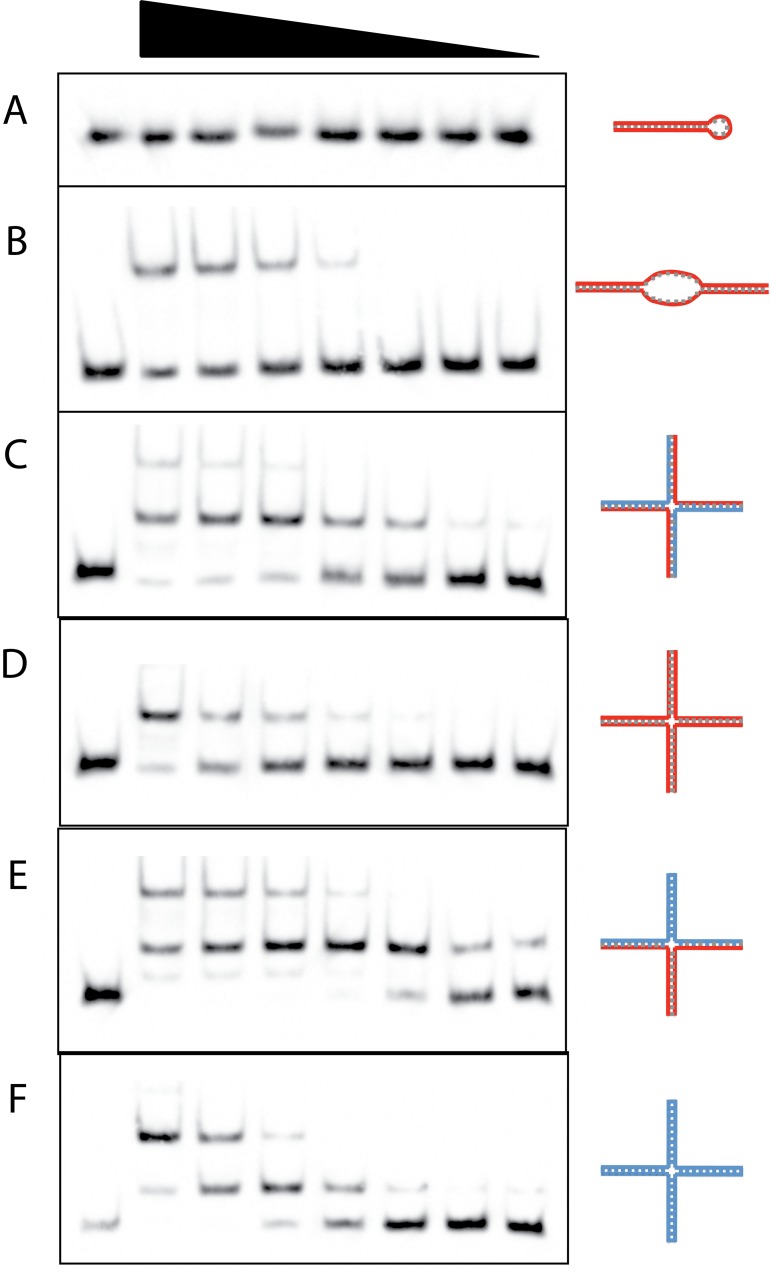
Fig 2. TFAM binding of complex DNA and RNA substrates by EMSA.
Varying amounts of TFAM were bound to 20 fM of each biotinylated substrate with as follows; (A) Stem-loop RNA, 2.4–0.0375 μM TFAM with two-fold serial dilutions, (B) dsRNA with internal 8 nucleotide mismatch loop, TFAM dilutions as in (A), apparent K d of 2.04 μM, (C) Alternating, four arm RNA:DNA 4-way junction, TFAM dilutions as in (A), apparent K d of 299 nM, (D) RNA 4-way junction, 600–9.375 nM TFAM with two-fold serial dilutions, apparent K d of 270 nM, (E) Mixed pairing RNA and DNA 4-way junction, TFAM dilutions as in (A), apparent K d of 63 nM, (F) DNA 4-way junction, TFAM dilutions as in (D), apparent K d of 63 nM. Left lane in each panel is free template without TFAM. Substrate diagrams appear to the right of each panel with RNA depicted in red and DNA in blue.

