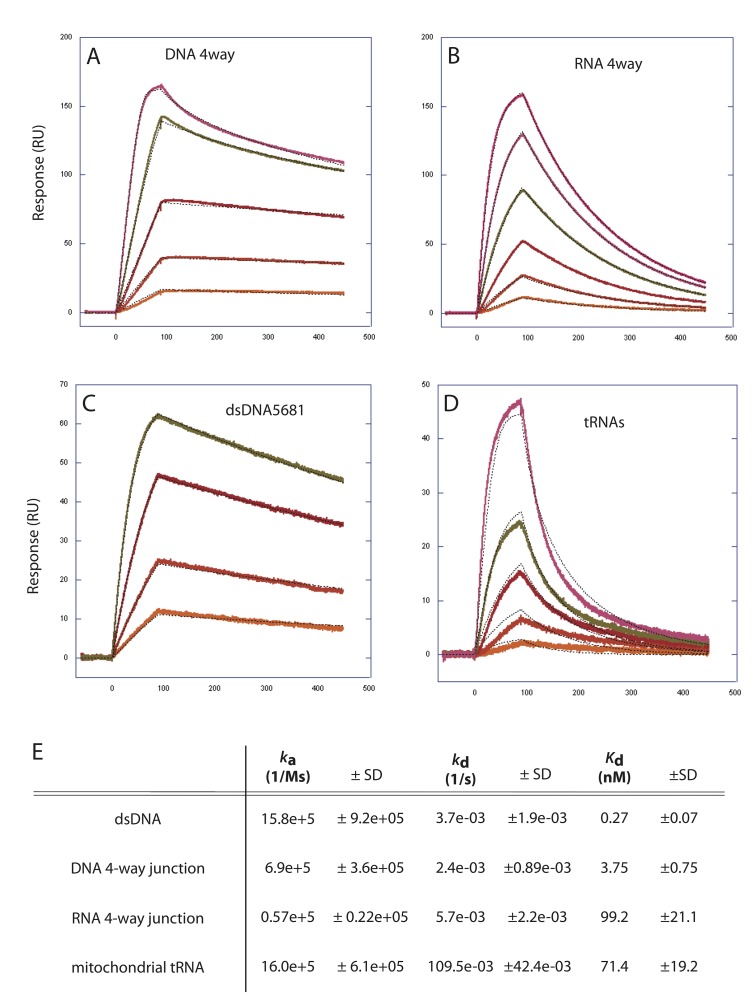
Fig 5. Binding kinetics of TFAM to RNA and DNA substrates using surface plasmon resonance.
(A-D) Sensograms displaying the TFAM binding and dissociation rates of (A) a DNA 4-way junction, (B) an RNA 4-way junction, (C) linear double-stranded DNA, and (D) purified mitochondrial tRNAs. Individual tracings represent a single value in a range of TFAM concentrations in each of the experiments. (E) Kinetic data derived from these tracings include associate rate constant (k a), dissociate rate constant (k d) and the apparent dissociation constant (K d) for each of these substrates.

