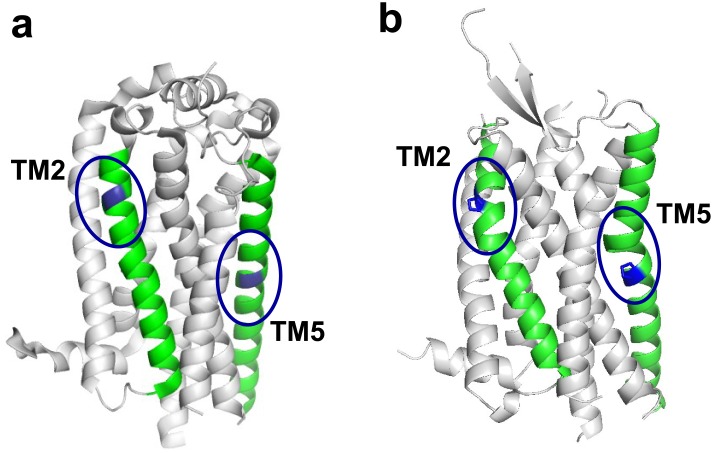
Fig 1. Structure of selected GPCRs.
Ribbon representation of the crystal structure of (a) S1P1R (PDB # 3V2Y) and (b) OX2 (PDB # 4S0V). TM2 and TM5 are green. Positions 2.59 and 5.50 are blue. The proline residues at positions 2.59 and 5.50 in OX2 are shown as sticks. Ovals indicate the positions of the helical distortions, if any.

