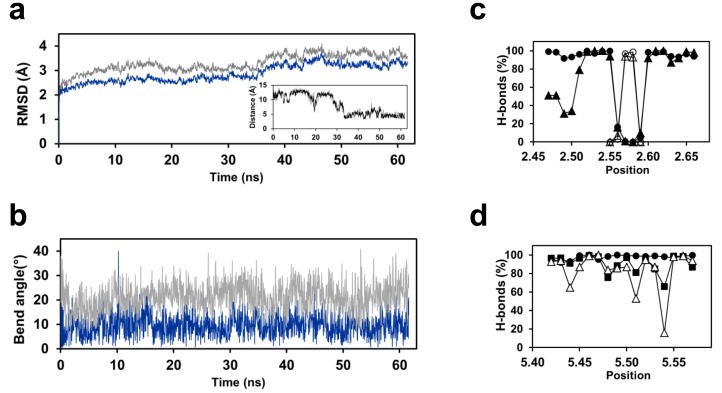
Fig 9. Analysis of the MD simulations of the TSHR transmembrane domain.
(a) Time evolution of the root mean squared deviations (RMSD) of the Cα atoms of the TSHR transmembrane domain (grey) or transmembrane helices only (blue). The insert shows the evolution of the distance between the Cδ atom of E3.37 and the Nδ1 atom of N4.47; (b) Time evolution of the bend angle of TM2 (grey) and TM5 (blue); (c) Backbone i to i-4 (closed symbols) and i to i-5 (open symbols) H-bonds in TM2. The percent of H-bonds was measured during the equilibration phase (triangles) and the production run (circles); (d) Backbone i to i-4 H-bonds in TM5 during the equilibration phase (triangles), the 35 first ns (squares) and the 25 last ns (circles) of the production run.

