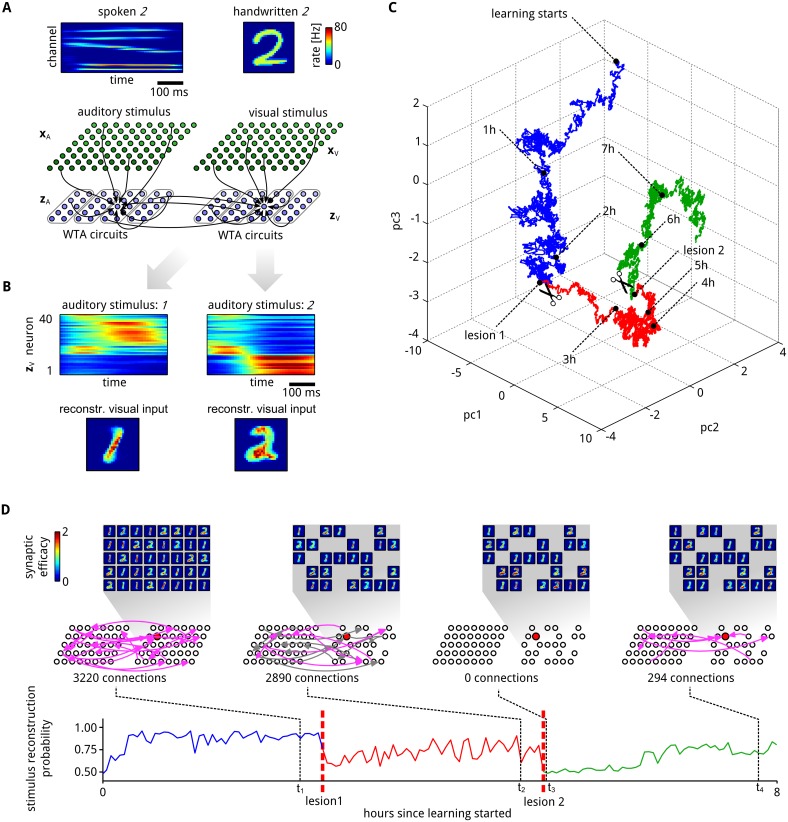
Fig 5. Inherent compensation for network perturbations.
A: A spike-based generative neural network (illustrated at the bottom) received simultaneously spoken and handwritten representations of the same digit (and for tests only spoken digits, see (B)). Stimulus examples for spoken and written digit 2 are shown at the top. These inputs are presented to the network through corresponding firing rates of “auditory” (x A) and “visual” (x V) input neurons. Two populations z A and z V of 40 neurons, each consisting of four WTA circuits like in Fig 4, receive exclusively auditory or visual inputs. In addition, arbitrary lateral excitatory connections between these “hidden” neurons are allowed. B: Assemblies of hidden neurons emerge that encode the presented digit (1 or 2). Top panel shows PETH of all neurons from z V for stimulus 1 (left) and 2 (right) after learning, when only an auditory stimulus is presented. Neurons are sorted by the time of their highest average firing. Although only auditory stimuli are presented, it is possible to reconstruct an internally generated “guessed” visual stimulus that represents the same digit (bottom). C: First three PCA components of the temporal evolution of a subset θ′ of network parameters θ (see text). Two major lesions were applied to the network. In the first lesion (transition to red) all neurons that significantly encode stimulus 2 were removed from the population z V. In the second lesion (transition to green) all currently existing synaptic connections between neuron in z A and z V were removed, and not allowed to regrow. After each lesion the network parameters θ′ migrate to a new manifold. D: The generative reconstruction performance of the “visual” neurons z V for the test case when only an auditory stimulus is presented was tracked throughout the whole learning session, including lesions 1 and 2 (bottom panel). After each lesion the performance strongly degrades, but reliably recovers. Insets show at the top the synaptic weights of neurons in z V at 4 time points t 1, …, t 4, projected back into the input space like in Fig 4E. Network diagrams in the middle show ongoing network rewiring for synaptic connections between the hidden neurons z A and z V. Each arrow indicates a functional connection between two neurons. To keep the figure uncluttered only subsets of synapses are shown (1% randomly drawn from the total set of possible lateral connections). Connections at time t 2 that were already functional at time t 1 are plotted in gray. The neuron whose parameter vector θ′ is tracked in (C) is highlighted in red. The text under the network diagrams shows the total number of functional connections between hidden neurons at the time point.

