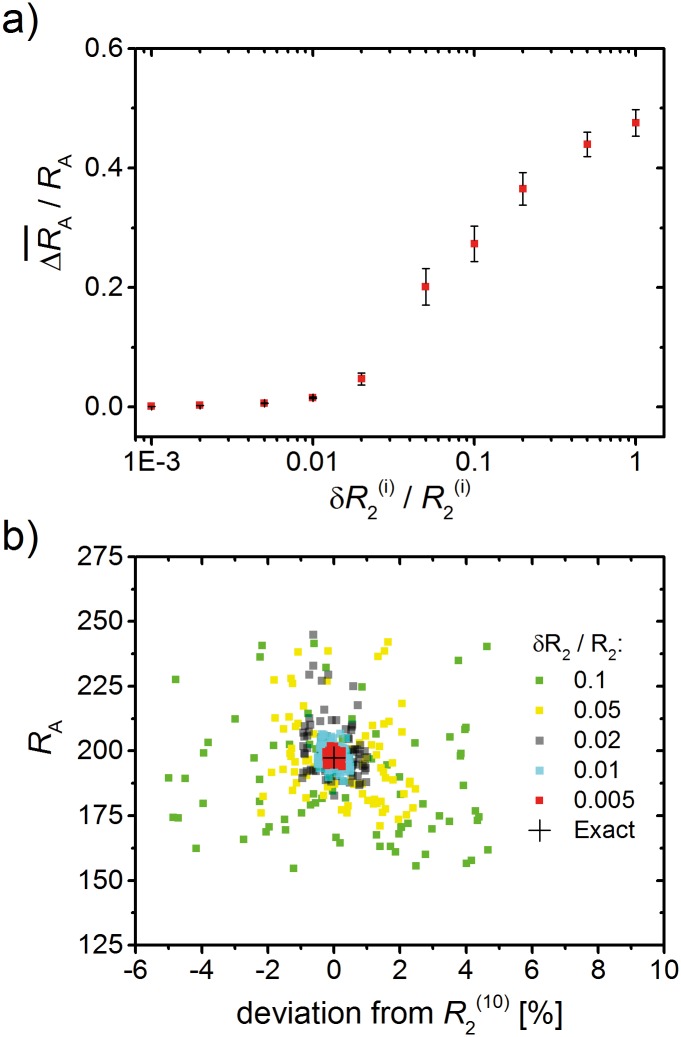
Fig 6. Sensitivity analysis for varying relaxation rates.
(a) All measured relaxation rates for the 3.5h experimental data (Fig 5a) were varied within different ranges with . For multiple sets of such variations, the average of the resulting difference to and in proportion of the initially obtained radius R A is negligible for relative ranges < 0.01. (b) Scatter plot of the resulting radii vs. deviations for the example for different strengths of variation; all other values were also varied within their respective error ranges as in (a).

