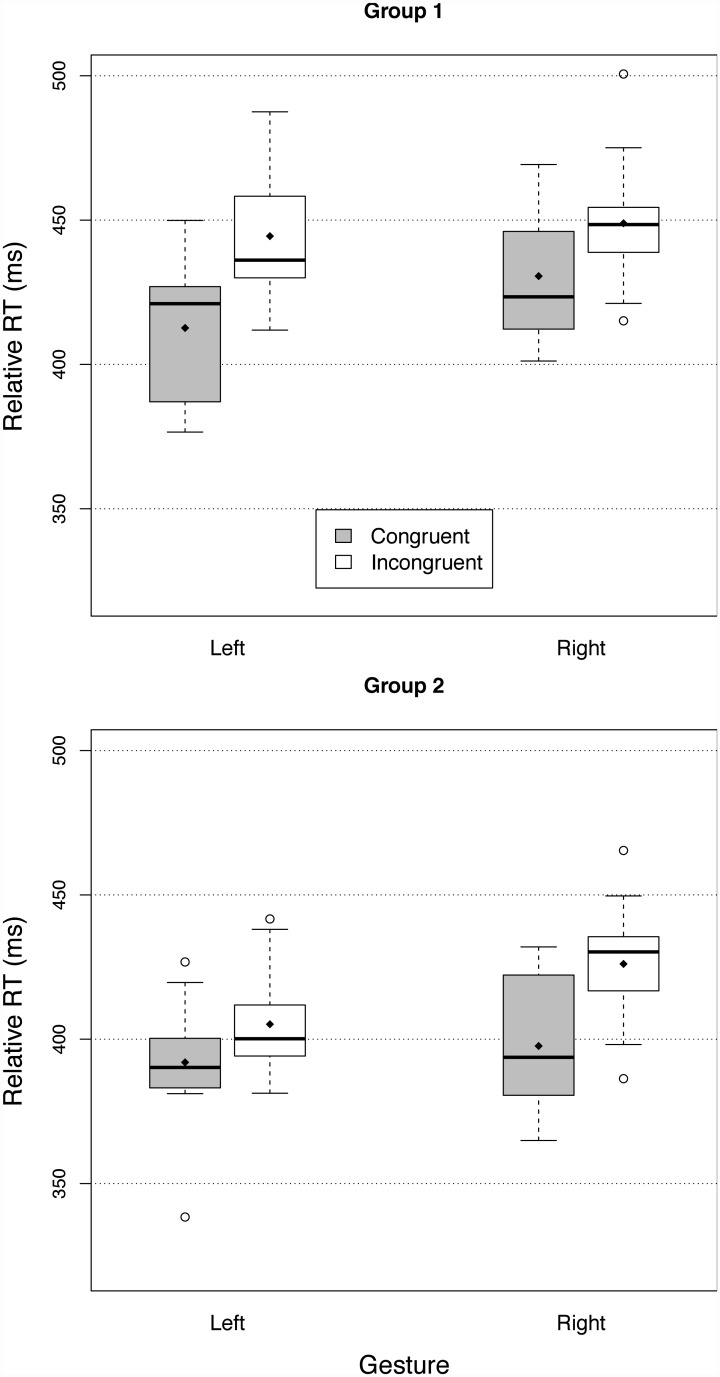
Fig 2. Relative reaction times in Experiment One (lifting a finger to initiate a high-pitched or a low-pitched tone)—with Group One (left hand high tone, top panel) and Group Two (left hand low tone, lower panel).
The solid box represents the interquartile (IQ) range of the distributions of RTs. The dashed lines represent the interquartile range plus or minus 1.5 IQ. Circles represent data points outside this range (i.e. outliers). The horizontal lines represent the median and the losanges the means of the distributions.

