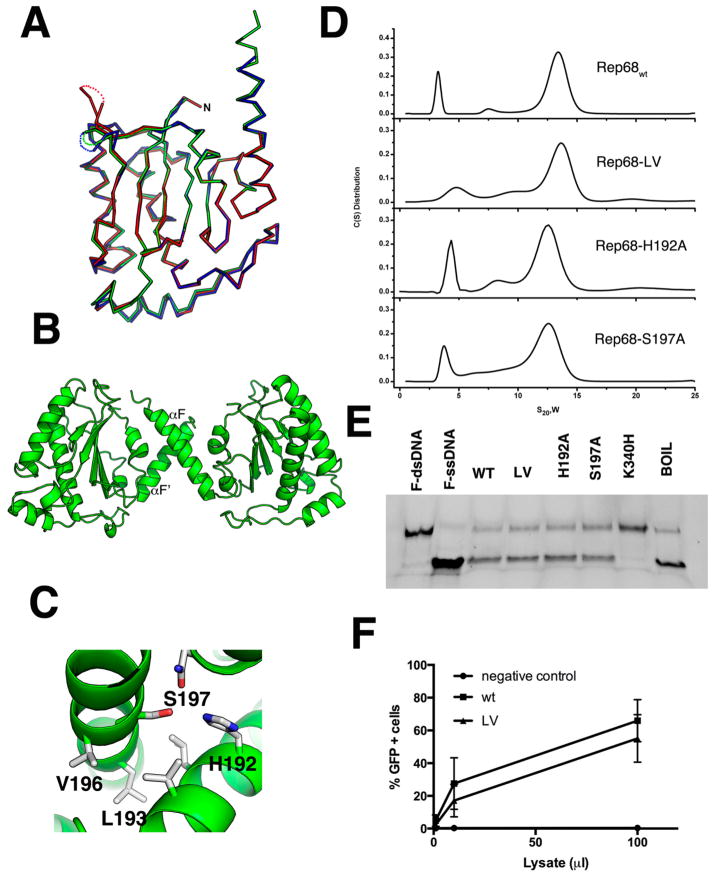
Figure 2.
Superposition of OBD molecules in the asymmetric unit. (A) Ribbon diagram of the superposition of the three molecules in the asymmetric unit. Molecule A is shown in green; molecule B, blue; and molecule C, red. The three loops LDB have different conformations and are shown as dotted connections. (B) Ribbon diagram of the dimer in the asymmetric unit formed by molecules A and B. The small dimer interface occurs through residues in α-helix F. (C) Details of the residues involved in the oligomeric interaction with Ser197, Val196, and Leu193 from molecule A interacting with His192, Leu193, and Val196 from molecule B. (D) Sedimentation velocity profiles of Rep68wt, Rep68-L193AV196A, Rep68-H192A, and Rep68-S197A. Experiments were carried out at 20 °C and 25 000 rpm on a Beckman XL-I analytical ultracentrifuge. Scans were collected every 2 min using absorbance at 280 nm. Data was analyzed using the program Sedfit.51 (E) Helicase assay of Rep68 mutants. Fluorescent-labeled DNA molecule has a 3′ single-stranded tail and an 18 bp region (first lane). Upon ATP addition, helicase activity is shown as the 18 nucleotide fluorescein-labeled ssDNA is displaced (second lane). Rep68, L193AV196A, H192A, and S197 proteins all unwind DNA. K340H mutant is ATPase-negative and does not unwind DNA. Last lane shows the DNA substrate after heating at 100 °C for 5 min. (F) Comparison of the production of rAAV2-GFP infectious particles in the presence of wt or LV mutant. Various volumes of supernatant (in (μ), x axis) from 293T cells producing rAAV2-GFP were added to HeLa cells, and the percentage of GFP-positive infected cells was determined by FACS analysis, as described in Materials and Methods. Data is presented as average ± standard deviation from three independent experiments.

