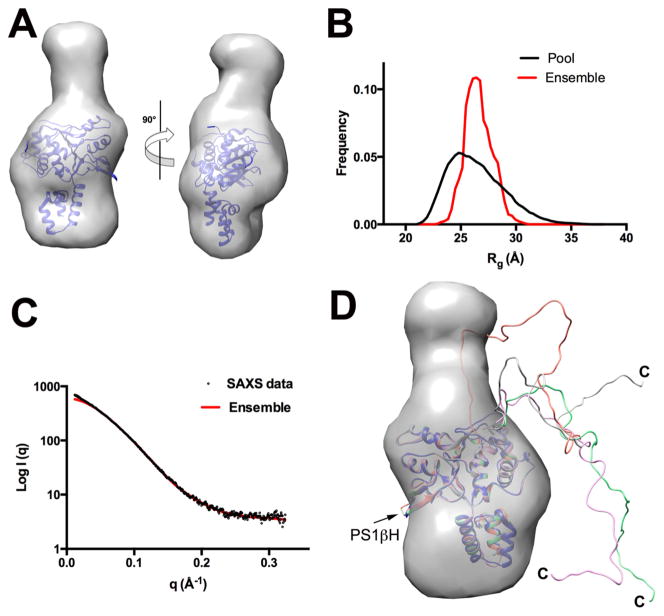
Figure 6.
SAXS analysis of Rep40/Rep68 C-terminal tail. (A) Shape reconstruction of Rep40wt and the docked X-ray structure of Rep40. (B) Comparison of the Rg distribution of the initial EOM generated pool (black line) and the selected model ensemble (red line). (C) Scattering curve of Rep40wt (black) and fit of the optimal EOM model ensemble (red). (D) Superposition of the ensemble generated model showing the preferred conformations of the C-terminal tails.

