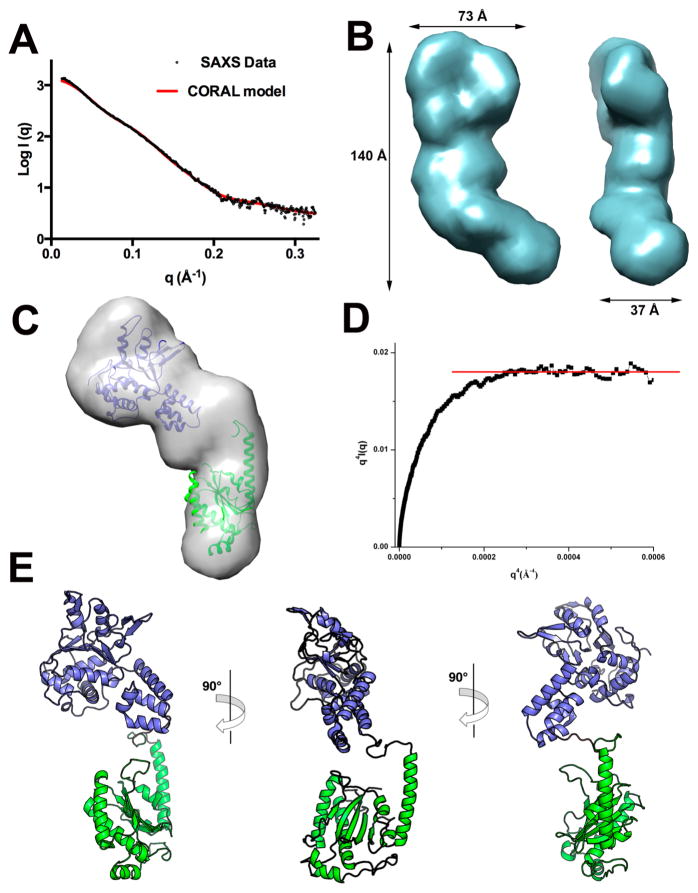
Figure 7.
SAXS modeling of Rep68. (A) Fit of the experimental SAXS data (black circles) with the theoretical scattering profile obtained from CORAL model (red line) with a χ value of 0.8. (B) Two views of the GASBOR averaged molecular envelope for Rep68Δ showing the approximate dimensions in angstroms. (C) Docking of OBDL and Rep40 atomic structures to the GASBOR ab initio envelope. (D) Porod–Debye plot of Rep68Y224AΔ SAXS data (black squares) supporting a compact protein with little flexibility. Red line represents the linear plateau. (E) Three views of the CORAL rigid-body final model of Rep68Y224AΔ.

