Figure 3.

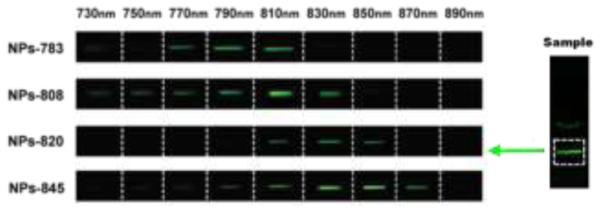
Photographic images of the corresponding solution samples taken under different excitation wavelengths from 730 nm to 890 nm. The right of the figure shows the portion of the light beam with each sample which was used for these images.

Photographic images of the corresponding solution samples taken under different excitation wavelengths from 730 nm to 890 nm. The right of the figure shows the portion of the light beam with each sample which was used for these images.