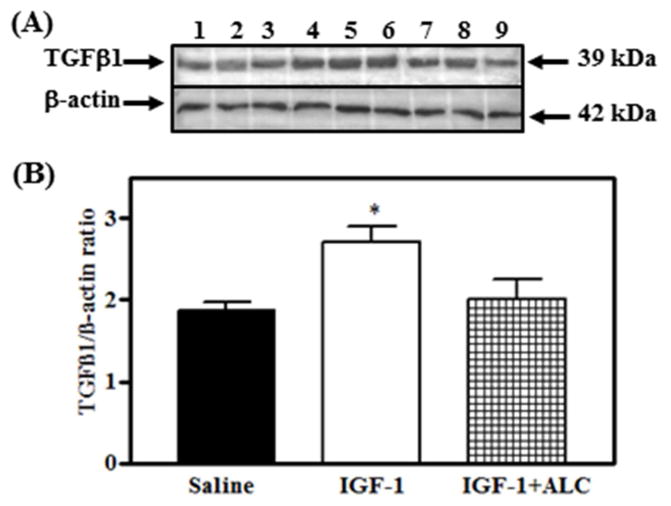
Fig. 8.
Effects of IGF-1 and acute alcohol exposure on TGFβ1 protein in the MBH of prepubertal female rats. A) Representative Western blot of TGFβ1 and β-actin proteins from saline (lanes 1–3), IGF-1 (lanes 4–6), and IGF-1 + alcohol (lanes 7–9) -treated animals. B) Densitometric quantification of all bands assessing the TGFβ1 protein. These data were normalized to the internal control β-actin protein. IGF-1 (open bar) induced an increase in TGFβ1 over saline-treated (solid bar) animals. Animals were dosed by gastric gavage with a 3 g/kg injection of alcohol, which yielded a peak serum alcohol level of 150–180 mg/dL after 90 min. At this time, IGF-1 (200 ng/mL) was injected into a third ventricular cannula. An additional 2 g/kg dose of alcohol was given 4 h after the initial dose to maintain moderately elevated serum alcohol levels. The tissues were collected 6 h after the infusion of IGF-1 and the serum alcohol levels at that time were 154 mg/dL (Hiney et al. 2014). Note that exposure to alcohol blocked the IGF-1-induced expression of TGFβ1 protein (hatched bar). Each bar represents the mean ± SEM of the TGFβ1/β-actin ratio. The number of animals represented by each bar is 6. *p < 0.05 vs. saline-treated and IGF-1 + alcohol-treated animals. Modifed from Hiney et al., 2014.

