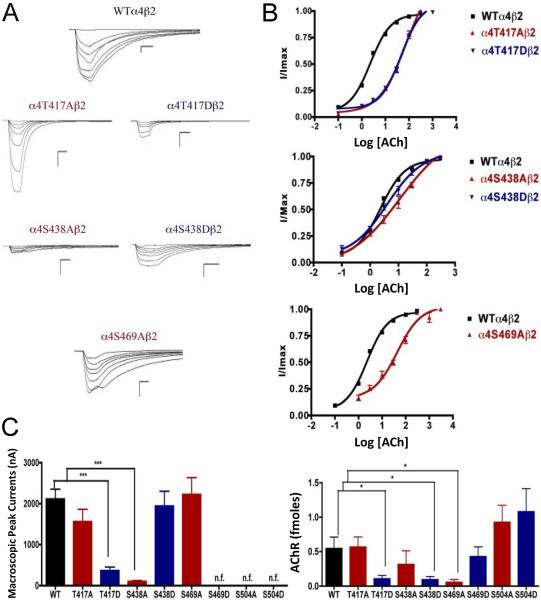
Fig. 3.
Binding and functional characterization of mutations on CKII putative phosphorylation sites in the α4 subunit with ACh used as an agonist. Mutations α4T417Aβ2, α4T417Dβ2, α4S438Aβ2, α4S438Dβ2, α4S469Aβ2, α4S469Dβ2, α4S504Aβ2, and α4S504Dβ2 were expressed in Xenopus laevis oocytes. (A) Family of ACh-induced macroscopic currents. Calibration bars are shown for all family of currents, horizontal bars indicate time (5 s) and vertical bars indicate the inward current (500 nA). (B) Dose-response curves obtained by voltage-clamp using ACh as agonist. ACh dose-response curves were determined using seven ACh concentrations (0.1, 1, 3, 10, 30, 100, and a seventh concentration ranging from 300 to 1000 μM depending on the mutant). The responses were normalized to the maximum response (I/Imax). (C) Left panel. Comparison of the macroscopic peak currents of all the mutations compared with the wild-type receptor, shown in nA. Right panel. Results of the 125I-labeled epibatidine binding experiments performed in Xenopus laevis oocytes expressing the mutations α4T417Aβ2, α4T417Dβ2, α4S438Aβ2, α4S438Dβ2, α4S469Aβ2, α4S469Dβ2, α4S504Aβ2, and α4S504Dβ2 and wild-type α4β2 nAChRs, shown in fmoles (n=6-17) (* p<0.05, ***p<0.0001).

