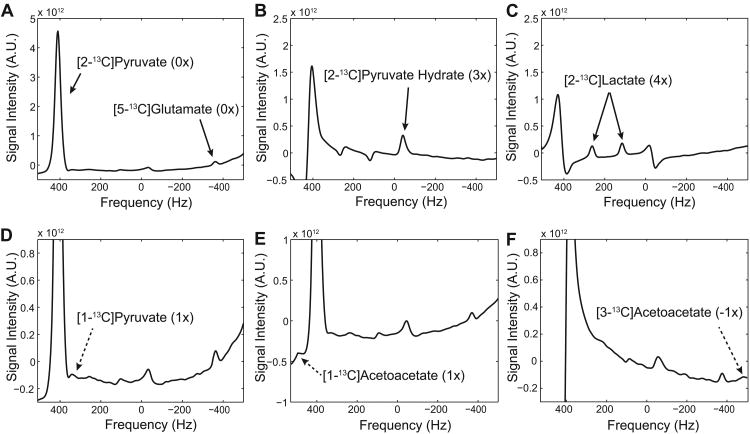
Figure 4. Spatially averaged brain spectra of healthy rat brain using scheme 1.
Post-DCA spectra averaged over the brain voxels and reconstructed separately for (A) [2-13C]pyruvate and [5-13C]glutamate, (B) [2-13C]pyruvate hydrate, and (C) [2-13C]lactate (D) A small [1-13C]pyruvate peak was detected while the other peak of the [1-13C]pyruvate doublet overlapped with the larger [2-13C]pyruvate peak. Small peaks of both (E) [1-13C]acetoacetate and (F) [3-13C]acetoacetate were also detected. The parentheses indicate the number of aliasing with a positive sign towards smaller chemical shifts.

