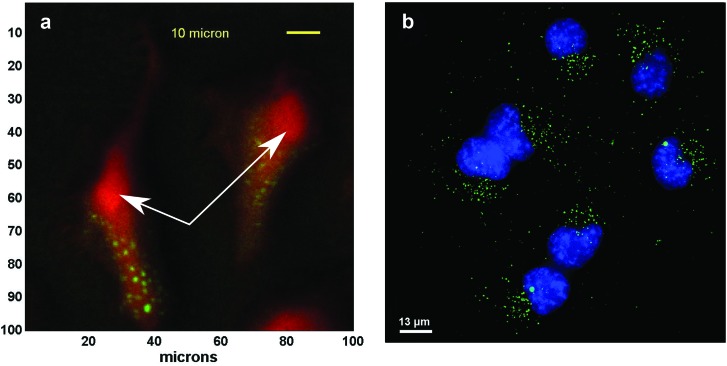
Fig. 1.
ToF-SIMS 3D and fluorescence images of cells with nanoparticles. Top view of summed signal from a ToF-SIMS 3D depth profile (a) and fluorescence image (b). Nanoparticle clusters (green—polymer peaks) can be seen within the cells (red—CN− peak in ToF-SIMS image). The particles are located outside of the cell nuclei (blue in fluorescence image, and red rounded areas in ToF-SIMS image). The white arrows indicate the location of the nuclei in the ToF-SIMS images.

